Operations | Monitoring | ITSM | DevOps | Cloud
Sysdig Boosts AWS Security with the First Automated Inline Scanning for Fargate
Automate Fargate image scanning
Discover how to automate AWS Fargate image scanning directly in your AWS environment and block vulnerabilities from reaching production, among other threats. AWS Fargate and ECS allow you to deploy containerized workloads quickly. Fargate is even more convenient, as you don’t have to take care of the infrastructure.
AWS threat detection using CloudTrail and Sysdig Secure
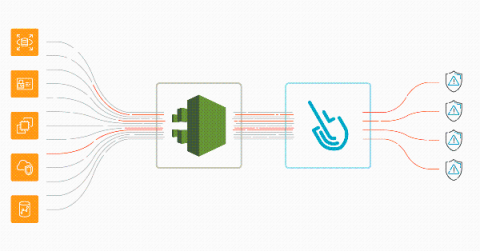
Implementing AWS threat detection with Sysdig Secure takes just a few minutes. Discover how to improve the security of your cloud infrastructure using AWS CloudTrail and Sysdig Cloud Connector. With the rise of microservices and DevOps practices, a new level of dangerous actors threatens the cloud environment that governs all of your infrastructure. A malicious or inattentive cloud API request could have a sizable impact on availability, performance, and last but not least, billing.
Securing and Monitoring AWS Container Services
Fargate scanning in under 4 minutes
How to monitor Istio, the Kubernetes service mesh
In this article, we are going to deploy and monitor Istio over a Kubernetes cluster. Istio is a service mesh platform that offers advanced routing, balancing, security, and high availability features, plus Prometheus-style metrics for your services out-of-the-box.
Five Prometheus exporters best practices to increase your productivity
The following Prometheus exporters best practices will help you implement a monitoring solution based on Prometheus, and will also increase your productivity. Prometheus is one of the foundations of the cloud-native environment. It has become the de-facto standard for visibility in Kubernetes environments, creating a new category called Prometheus monitoring.
What's new in Sysdig - September 2020
Welcome to our monthly update on what’s new from Sysdig! This month is a little eclipsed by last month’s big launch of Essentials and our new SaaS regions, KubeCon EU, and many of us finishing off the summer holidays and getting the kids packed off back to school. Our teams are busy working on some big feature releases which we don’t want to reveal just yet, but I think you’re all going to really love them in the coming months!
Manage AppArmor profiles in Kubernetes with kube-apparmor-manager
Discover how Kube-apparmor-manager can help you manage AppArmor profiles on Kubernetes to reduce the attack surface of your cluster. AppArmor is a Linux kernel security module that supplements the standard Linux user and group-based permissions to confine programs to a limited set of resources. AppArmor can be configured for any application to reduce its potential attack surface and provide greater in-depth defense.


