Operations | Monitoring | ITSM | DevOps | Cloud

June 2023

What is High Cardinality Data?

While reading a GitHub issue on the OpenTelemetry Collector about trying to send two versions of a metric, one with higher and one with lower cardinality, it occurred to me that we’ve never written on this blog about what is high-cardinality data exactly and how it matters to your OpenTelemetry observability. High-cardinality data refers to a dataset or data attribute that contains a large number of distinct values relative to the total number of data points.

SigNoz - Open-source alternative to Dynatrace

If you're looking for an open-source alternative to Dynatrace, then you're at the right place. SigNoz is a perfect open-source alternative to Dynatrace. SigNoz provides a unified UI for metrics, traces and logs with advanced tagging and filtering capabilities. In today's digital economy, more and more companies are shifting to cloud-native and microservice architecture to support global scale and distributed teams.

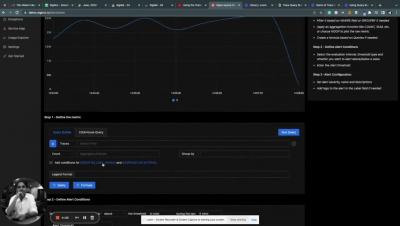
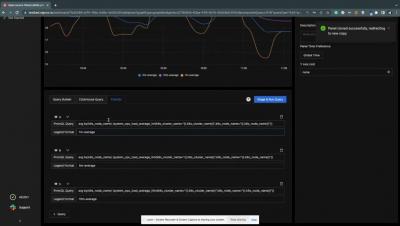
13,000+ GitHub stars, new Trace and Logs Query Builder, Correlated Signals & more - SigNal 25

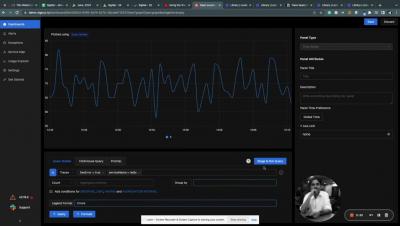
Welcome to the 25th edition of our monthly product newsletter - SigNal 25! Our team shipped important upgrades to SigNoz, like new trace and logs query builder. We also attended many events and had a small get-together after months. Let’s dive in to see what humans at SigNoz were up to in the month of May 2023.

Complete Guide to tracing Kafka clients with OpenTelemetry in Go

OpenTelemetry can be used to trace Go applications that use Kafka to find performance issues and bugs. OpenTelemetry is an open-source project under the Cloud Native Computing Foundation (CNCF) that aims to standardize the generation and collection of telemetry data. Telemetry data includes logs, metrics, and traces. Apache Kafka introduced the ability to add headers to Kafka messages from version 0.11 onwards.

Redis Monitoring | 101 Guide to Redis Metrics Monitoring

Monitoring Redis for performance issues is critical. Redis is famous for its low-latency response while serving a large number of queries. There are certain key metrics that you can monitor to keep track of your Redis instance performance. In this guide, we will go through key Redis metrics that should be monitored and ways to collect these metrics with in-built Redis tools.

Top 11 MYSQL monitoring tools in 2023 [open-source included]

Database monitoring is a critical component in your application performance monitoring. Apart from application code issues, database issues are one of the most common reasons for a bad user experience. MySQL is one of the most popular open-source DBMS that businesses have widely adopted. MySQL monitoring tools can help you identify potential issues with your database, keep a continuous check on your database instances, improve performance and detect and alert you about real-time issues.