Operations | Monitoring | ITSM | DevOps | Cloud

April 2022

Kubernetes Incident Response Best Practices

Inevitably, organizations that use technology (regardless of the extent) will have something, somewhere, go wrong. The key to a successful organization is to have the tools and processes in place to handle these incidents and get systems restored in a repeatable and reliable way in as little time as possible.

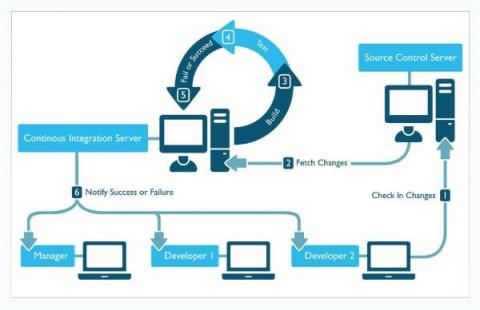
CI/CD & DevOps Pipeline Analytics: A Primer

Tracking application-level and infrastructure-level metrics is part of what it takes to deliver software successfully. These metrics provide deep visibility into application environments, allowing teams to home in on performance issues that arise from within applications or infrastructure. What application and infrastructure metrics can’t deliver, however — at least not on their own — is breadth.

Break Silos and Foster Collaboration with DevOps

DevOps is a well established discipline. By now, most developers, IT engineers and site reliability engineers (SREs) have heard all about the importance of “breaking down silos” and achieving seamless communication and collaboration across all stakeholders in the continuous integration/continuous delivery (CI/CD) process — which extends from source code development through production environment management and incident response.

Using AI & ML for Application Performance (APM)

Today, IT and site reliability engineering (SRE) teams face pressure to remediate problems faster than ever, within environments that are larger than ever, while contending with architectures that are more complex than ever. In the face of these challenges, artificial intelligence has become a must-have feature for managing complex application performance or availability problems at scale.

Cloud Log Management Strategy & Best Practices

For IT Operations and Site Reliability Engineering (SRE) teams, logging is nothing new. In fact, collecting and analyzing logs is one of the oldest cornerstones of performance management. Logs have been part and parcel of APM workflows for decades. Yet the logging strategies that worked in eras past often fall short today. That’s thanks to the advent of cloud-native computing, which has ushered in fundamental new challenges in the way teams aggregate, analyze, and manage logs.

Synthetic Monitoring for CI/CD Pipelines

For DevOps teams, delivering quality software has long required reconciling a major tension: In a perfect world, you’d catch every issue in each new release of your application before you deployed the release into production. But in the real world, doing so is tricky, not least because it’s hard to collect data about application performance before the application is actually deployed.

On-Premises Application Monitoring: An Introduction

In the present age of cloud-native everything, it can be easy to forget that some applications still run on-premises. But they do and managing the performance of on-premises apps is just as important as monitoring those that run in the cloud. With that reality in mind, here’s a primer on how to approach on-premises application performance monitoring as part of a broader cloud-native performance optimization strategy.

Distributed Tracing Best Practices for Microservices

The management of modern software environments hinges on the three so-called “pillars of observability”: logs, metrics and traces. Each of these data sources provides crucial visibility into applications and the infrastructure hosting them. For many IT operations and site reliability engineering (SRE) teams, two of these pillars — logs and metrics — are familiar enough.

SRE vs DevOps: What's The Difference?

Whether you’ve heard of or fully jumped on the DevOps or SRE bandwagon, you may have also wondered how the two relate. What’s the difference? Are they really just different ways of looking at the same problem? The term DevOps hit the market first, but SRE wasn’t too far behind. And though they have different origin stories, they both focus on autonomy, automation, and iteration. So why do these paradigms exist? And why do we need both? Let’s look at this further.

Splunk Operator 1.1.0 Released: Monitoring Console Strikes Back!

The latest version of the Splunk Operator builds upon the release we made last year with a whole host of new features and fixes. We like Kubernetes for Splunk since it allows us to automate away a lot of the Splunk Administrative toil needed to set up and run distributed environments. It also brings a resiliency and ease of scale to our heavy-lifting components like Search Heads and Indexer Clusters.

What is Splunk? (2022)

How do you thrive in today’s unpredictable world? You keep your digital systems secure and resilient. And above all, you innovate, innovate, innovate. Splunk is the extensible data platform that processes data from any cloud, any data center and any third party tool. At massive scale. We’re ready to help you accelerate your digital transformation and pave the way for incredible innovation.

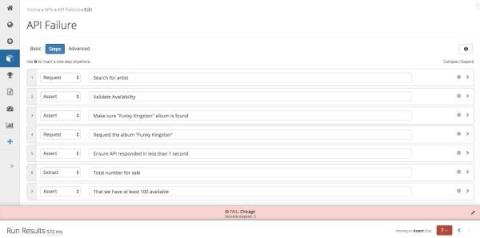
API Testing vs Monitoring: What's The Difference?

We’ve already outlined why API performance matters and what aspects of APIs to test, but what is the difference between API testing and monitoring? As with most things, context matters. The use cases for testing and monitoring are different because the objectives are different. The ultimate goal is to verify that your APIs are functioning properly, but staging environments vary significantly from production environments.

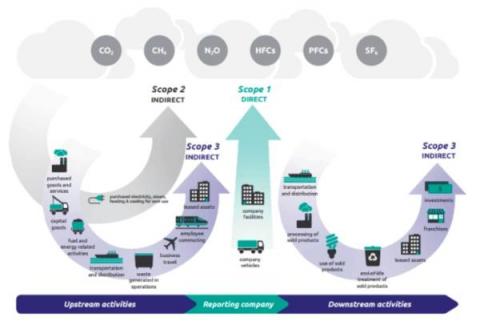
Tackling Your Carbon Footprint with the Sustainability Toolkit for Splunk

Simple questions can be overwhelming and not knowing the answer after a mouse click is no longer an option: Sustainability is top of mind for organizations across all verticals and Splunk can help with the power of data. Our upcoming Sustainability Toolkit based on the Splunk platform equips organizations with capabilities to gain deep insights into their carbon footprint and as such empowers them to take the necessary actions towards their carbon neutrality goals.

Log Observer Connect: Leverage the power of Splunk Enterprise data in Splunk Observability Cloud

With Splunk Log Observer Connect it’s easier than ever to correlate all of your metric, trace and log data to deliver better customer experiences! Available now for existing Splunk Enterprise and Splunk Observability Customers. Log Observer Connect lets observability users explore the data they’re already sending to their existing Splunk instances with Splunk Log Observer’s intuitive no-code interface integrated in Splunk Observability, for faster troubleshooting, root-cause analysis and better cross-team collaboration.

API Testing: An Introduction

Digital businesses are making a radical change in the way they build and deliver software. Gone are the days of apps that rely solely on in-house tools. Rather, today’s apps are increasingly dependent on external APIs and third-party app providers (which, in turn, are reliant on other APIs and apps). While this type of modularity allows for product flexibility and rapid development, it can be difficult to address any issues that arise.

Splunk Embarks on AWS Graviton Journey with Amazon EC2 Im4gn and Is4gen Instances

We are excited to announce that Splunk Cloud Platform is moving to next generation AWS Graviton2 processor hardware to help enable enhanced performance for customers who choose AWS as a provider. This begins a phased transition of our Splunk Cloud Platform indexer tier in a move that will help Splunk operate more efficiently and provide customers with the cutting edge in processing technology.

A Primer for Monitor as Code: How to use Splunk Observability Cloud with Terraform

Managing the complexities of today’s cloud native infrastructure has resulted in the increased need for observability. As cloud adoption continues to grow, the need to deliver a better customer experience, scale efficiently and increase momentum on innovation has never been more important. For many organizations to carry out these principles, two technologies are helping organizations deliver on these goals faster: Monitoring-as-Code and Infrastructure-as-Code.