Operations | Monitoring | ITSM | DevOps | Cloud

March 2023

Using Rollbar for Performance Monitoring

Rollbar allows you to gain real-time visibility into exceptions and crashes in your applications and act on them quickly and easily. An important piece of any application is knowing if transactions are executing slower or below a certain threshold. Rollbar provides an easy method to send this data to be processed quickly and easily inside your existing Rollbar project.

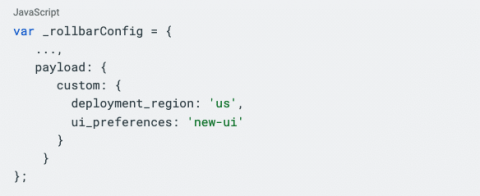
How to add context to errors with custom tags

An important component of understanding the root cause of an error, and the importance of an error to the business is having additional contextual information about the error. The specific additional data that is important for your errors will be unique for your application and possibly the category of the error. Rollbar provides an easy way to tag your error data with additional custom tags. There are 2 main ways of doing this.

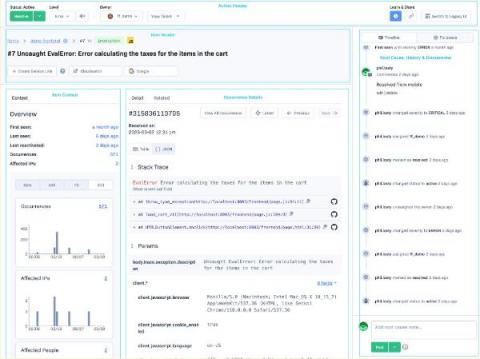
Introducing our new Item Detail page

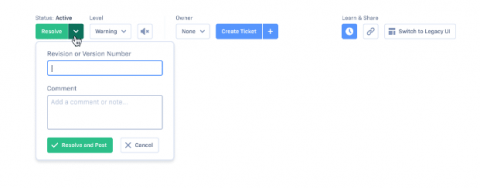
We’re excited to share a significant update to all Rollbar plans in the next few weeks. We’ve redesigned our item detail page with a new mobile layout, prioritized important error context, display occurrence details more clearly, and put all actions at your fingertips. With our new UI, we are confident you will work more efficiently, so you can resolve errors quickly and get back to your essential work.

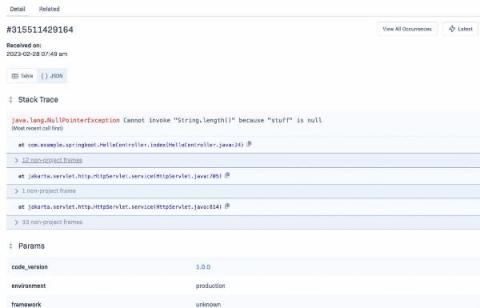
Reducing noise in Stack Traces by collapsing non-project frames

Debugging errors in your software often requires browsing stack traces (also called as backtraces or tracebacks). A stack trace is a sequence of stack frames which represents the chain of methods calling each other in your software. Rollbar collects your stack trace at the time a crash occurs – this way you will be able to know which pieces of code were active when an issue happened. You can find how to read stack traces in our previous blog post.