Operations | Monitoring | ITSM | DevOps | Cloud

October 2023

PromCon Recap: Prometheus Ecosystem Updates

In the first part of our 2023 PromCon recap, we spent OpenObservability Talks exploring the Perses open source project. We found heavy users of open source Grafana who found themselves grappling with issues arising from managing a vast number of dashboards, and the need to manage dashboards as code in a GitOps fashion.

PromCon Recap: Unveiling Perses, the GitOps-Friendly Metrics Visualization Tool

In the vibrant atmosphere of PromCon during the last week of September, attendees were treated to a plethora of exciting updates from the Prometheus universe. A significant highlight of the event has been the unveiling of the Perses project. With its innovative approach of dashboard as code, GitOps, and Kubernetes native features, Perses promises a revolutionary experience for Prometheus users, which gained a lot of traction at the conference.

Challenge Met: Adopting Intelligent Observability Pipelines

Over the last year or so, the unavoidable topic of overwhelming cost has emerged as the number one issue among today’s observability practitioners. Whether it is in conversations among end users, feedback from customers and prospects, industry chatter or the coverage of experts including Gartner, the issue of massive telemetry data volumes driving unsustainable observability budgets prevails.

Your Guide to Prometheus Observability

Imagine you’re piloting a spaceship through the cosmos, embarking on a thrilling journey to explore the far reaches of the universe. As the captain of this ship, you need a dashboard that displays critical information about your vessel, such as fuel levels, navigation data, and life support systems. This dashboard is your lifeline, providing you with real-time insights about the health and performance of various systems within your ship, so you can quickly make critical decisions.

An Overview of the Essential Observability Metrics

Metrics are closely associated with cloud infrastructure monitoring or application performance monitoring – we monitor metrics like infrastructure CPU and request latency to understand how our services are responding to changes in the system, which is a good way to surface new production issues. As many teams transition to observability, collecting metric data isn’t enough.

Full Stack Observability Guide - Examples and Technologies

As modern software systems become increasingly distributed, interconnected, and complex, ensuring production reliability and performance is becoming harder and more stressful. Seemingly nondescript changes to our infrastructure or application can have massive impacts on system uptime, health, and performance, all while the cost of production incidents continues to grow.

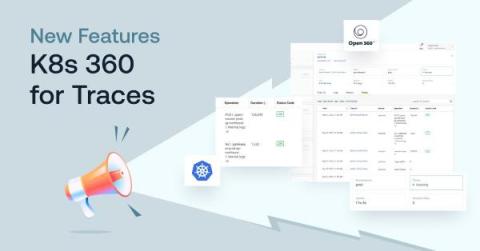
Tracing Your Steps Toward Full Kubernetes Observability

Kubernetes is one of the most important and influential technologies for building and operating software today because it’s so incredibly capable. It’s flexible, available, resilient, scalable, feature-rich and backed by a global community of innovators — that’s a pretty impressive list of intangibles to apply to any particular capability.