Operations | Monitoring | ITSM | DevOps | Cloud

August 2020

The concise guide to labels in Loki

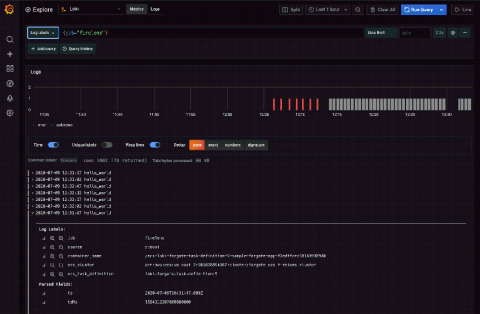
A few months ago, I wrote an in-depth article describing how labels work in Loki. Here, I’m consolidating that information into a more digestible “cheat sheet.” There are some big differences in how Loki works compared to other logging systems which require a different way of thinking. This is my attempt to convey those differences as well as map out our thought process behind them. As a Loki user or operator, your goal should be to use the fewest labels possible to store your logs.

Popular community plugins that can improve your Grafana dashboards

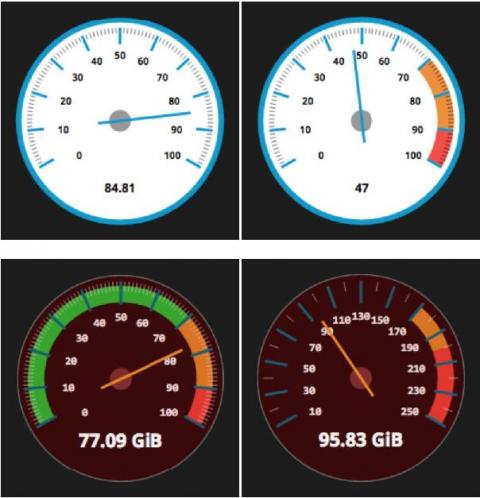
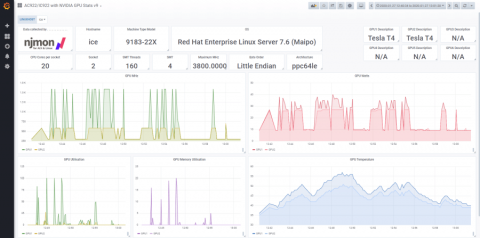
One thing we believe at Grafana Labs is that your data should be presented in a way that makes sense to you. Since the release of Grafana v7.0, we’ve seen a lot more developers taking advantage of the new plugins platform, which helps them build high-quality custom plugins faster than ever.

3 tips to improve your Grafana dashboard design

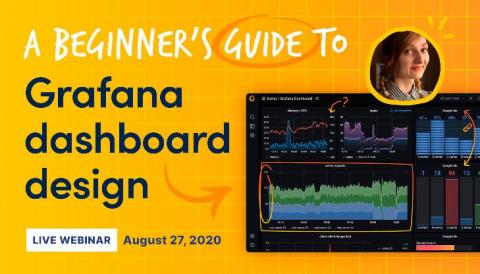
Every Grafana user is a dashboard designer. The Grafana community gladly shares their dashboards, so there’s tons of inspiration available. Chances are you’ve downloaded some community dashboards and tweaked them in search of patterns that work for you. But if you haven’t found them, you’re not alone! In my Aug. 27 webinar, “A beginner’s guide to dashboard design,” I’ll cover the basics of good dashboard design.

[KubeCon + CloudNativeCon EU recap] Better histograms for Prometheus

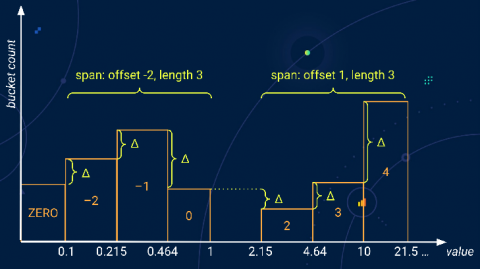
It’s only four months ago that I blogged about histograms in Prometheus. Back then, I teased my talk planned for (virtual) KubeCon Europe 2020. On Aug. 20, the talk finally happened. It completed the trilogy of histogram talks also mentioned in my previous blog post. Here is the recommended viewing order.

Cortex, the scalable Prometheus project, has advanced to incubation within CNCF

I’m pleased to report that today, the Cortex project advanced from sandbox to incubation within the Cloud Native Computing Foundation after a vote from CNCF’s Technical Oversight Committee (TOC). The TOC’s decision is a signal that Cortex has stepped up in maturity, attracting not just innovators but also early adopters among enterprises. To achieve incubation, CNCF projects undergo due diligence and have to demonstrate a healthy level of adoption and community activity.

[KubeCon + CloudNativeCon EU recap] Getting some Thanos into Cortex while scaling Prometheus

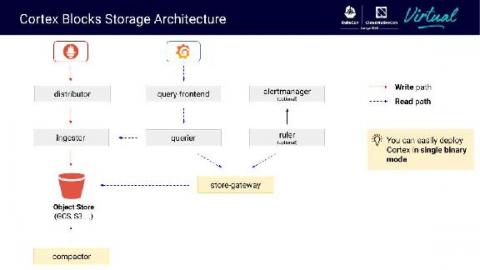
Yesterday at KubeCon + CloudNativeCon EU, Grafana Labs software engineer Marco Pracucci, a Cortex and Thanos maintainer, teamed up with Thor Hansen, a software engineer at Hashicorp, to give a presentation called “Scaling Prometheus: How we got some Thanos into Cortex.” In their talk, the pair discussed a new storage engine they have built into Cortex, how it can reduce the Cortex operational cost without compromising scalability and performance, and lessons learned from running Cortex at s

Introducing the Grafana Accelerator Program, one of the investments we're making in the community after raising $50 million

This morning, we announced that we raised $50 million in Series B funding. This additional funding, following our $24 million round last October, will enable us to dramatically accelerate research and development at Grafana Labs. We plan to hire more engineers and focus on product innovation. And importantly, it will help us continue to nurture and grow our community of millions of developers around the world.

Loki 1.6.0 released: Metric query performance up to 10x faster, push logs from any client to Promtail, query language and LogCLI enhancements, and more!

Things have been busy with the Loki project! Once again, we waited too long between releases, and there are so many new things I won’t be able to list them all. But that won’t stop me from trying, so let’s get to it. For a change of pace, instead of listing interesting PRs, I’m going to talk through Loki’s components and mention the changes in more of a paragraph style. Let’s see how this goes.

Scaling Prometheus: How we're pushing Cortex blocks storage to its limit and beyond

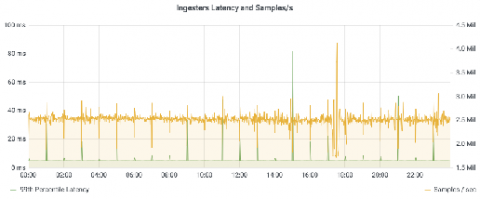
In a recent blog post, I wrote about the work we’ve done over the past year on Cortex blocks storage. Cortex is a long-term distributed storage for Prometheus. It provides horizontal scalability, high availability, multi-tenancy and blazing fast query performances when querying high cardinality series or large time ranges.

New in Grafana 7.1: Gain new data insights with InfluxDB and Flux query support

The audience was buzzing when Ryan McKinley, VP of Innovation at Grafana Labs, demoed the new native support for InfluxDB Flux queries in his talk at the InfluxDays virtual conference in late June. Whether the goal is to build IoT applications, or monitor DevOps infrastructure or another application or system, it’s important to move beyond just visualizing the data.

A conversation about Grafana Labs' new partnership with New Relic

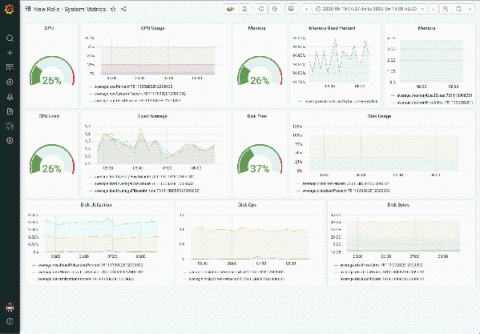
In helping users unify and contextualize all their observability data, Grafana is completely database-agnostic. “We believe that organizations get the best view of what’s going on when they pull in their data from wherever it lives,” said Raj Dutt, CEO of Grafana Labs, the company behind Grafana.

Loki tutorial: How to send logs from Amazon's ECS to Loki

Elastic Container Service (ECS) is the fully managed container orchestration service by Amazon. Combined with Fargate, Amazon’s serverless compute engine for containers, you can run your container workload without the need to provision your own compute resources. But how can you consolidate and query all of your logs and metadata for these workloads? Enter Loki, the log aggregation system from Grafana Labs that has proven to increase performance and decrease costs.

Is your Grafana dashboard ready to spot chaos?

When it comes to systems reliability, you wouldn’t normally think that unleashing additional chaos would actually be helpful, would you? As more engineering teams moved toward microservice-based architectures for cloud applications over the course of this past decade, many of them didn’t change their testing strategies.

How to stream Graphite metrics to Grafana Cloud using carbon-relay-ng

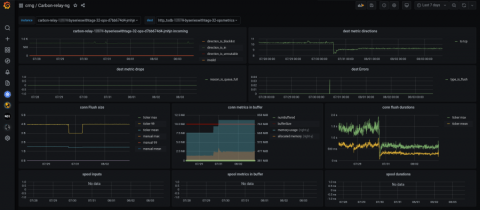
In this post we’ll show how you can easily ship your existing Graphite metrics to Grafana’s managed metric offering using carbon-relay-ng. Carbon-relay-ng is a fast, go-based carbon-relay replacement that allows you to easily aggregate, filter and route your Graphite metrics. This post assumes you have a local carbon-relay-ng binary. You can download carbon-relay-ng binaries from the releases page and find documentation on Docker images, Linux packages, and how to build it yourself here.