Operations | Monitoring | ITSM | DevOps | Cloud

Databases

The latest News and Information on Databases and related technologies.

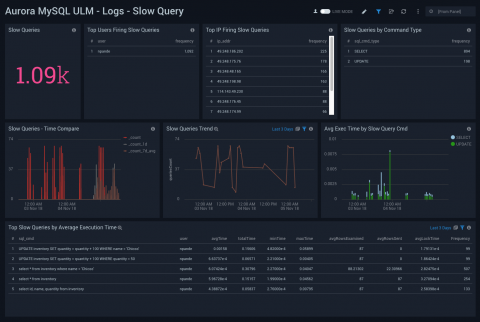
Complete Visibility of Amazon Aurora databases with Sumo Logic

Sumo Logic provides digital businesses a powerful and complete view of modern applications and cloud infrastructures such as AWS. Today, we’re pleased to announce complete visibility into performance, health and user activity of the leading Amazon Aurora database via two new applications – the Sumo Logic MySQL ULM application and the Sumo Logic PostgreSQL ULM application.

Top metrics to consider while monitoring DynamoDB performance

NoSQL databases have always been regarded as a notch above SQL databases. The primary reason for the soaring popularity of NoSQL databases is their dynamic and cloud-friendly approach to seamlessly processing data across a large amount of commodity servers. With high scalability, availability, and reliability, AWS’s DynamoDB is a great example of a fully-managed NoSQL database.

Free NHibernate Profiler to View SQL Query Performance

Let’s begin with a little thought experiment. Imagine you’re responsible for the next release of your company’s flagship product, and today is the big day: you’re about to give a demo presentation for all the big shots in the company. The CTO is obviously there, since she’s your boss. The CEO is there as well, along with the VP of Marketing and some of the company’s investors. So, that’s your boss, your boss’s boss, and the moneymakers.

Free Entity Framework Profiler to View SQL Query Performance

Picture this: you’re standing in the largest meeting room in your company. Behind you, a huge LED monitor. In front of you, all members of the C-suite. The CTO, your direct boss, is visibly nervous. The CEO looks interested and somewhat excited. The CFO looks happier than usual, though it probably has more to do with his very successful golf round the day before and nothing to do with the presentation you’re about to give.

Make time-series exploration easier with the PostgreSQL/TimescaleDB query editor

Grafana v5.3 comes with a new visual query editor for the PostgreSQL datasource. The query editor makes it easier for users to explore time-series data by improving the discoverability of data stored in PostgreSQL. Users can use drop-down menus to formulate their queries with valid selections and macros to express time-series specific functionalities, all without a deep knowledge of the database schema or the SQL language.

How to install a High Availability Database Cluster with Pandora FMS

Pandora FMS relies on a MySQL database for configuration and data storage. A database failure can temporarily bring your monitoring solution to a halt. The Pandora FMS high availability database cluster allows you to easily deploy a fault-tolerant, robust architecture.