Operations | Monitoring | ITSM | DevOps | Cloud

Latest Blogs

Instrument Your Python App Automatically With The Honeycomb Beeline for Python

We’ve been on a roll this year with Beelines, our integrations for quick, easy, and automagic instrumentation of your apps. You may have already seen our Node.js, Ruby, and Go beelines – today, we’re excited to announce the release of the Honeycomb Beeline for Python!

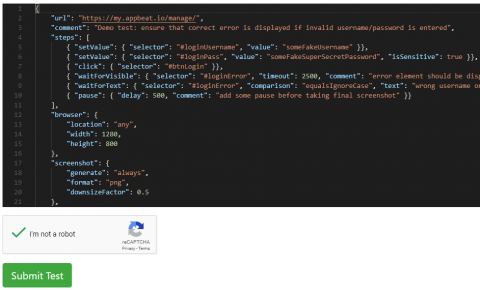
Selenium based functional testing & transaction monitoring

This functionality was frequently requested by our users and now we finally have it - automated synthetic monitoring using real browser! It allows you to periodically simulate user interaction with you web application by entering form fields, submitting forms, clicking links and buttons, etc. For list of currently available browser commands please visit our "Quick reference" section.

Best Practices for Incident Resolution

Believe it or not, there is a difference between incident closure and incident resolution. Incident closure ensures a problem has been addressed. Comparatively, incident resolution goes a step further by ensuring an incident is closed and all stakeholders are satisfied with the end results and agree with the incident closure.

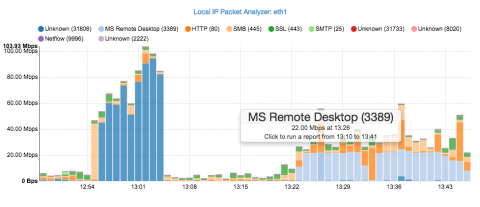
Network Monitoring Comparison - Solarwinds and Netmon

Network Monitoring is essential for every network administrator. It determines how effective your IT team is at solving problems or even completely eliminating them. Even small organizations need visibility of what is happening within their network environment. This includes the ability to know what is happening with their servers, network infrastructure and the traffic that flows across the network and all connected network devices.

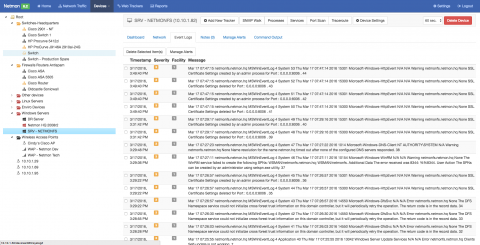
Configuring SYSLOG / Event Log on a Windows Device

Netmon’s complete Network Monitoring Solution can also be used as a centralized SYSLOG and Windows Event Log Server where you can quickly look through many Servers, Workstations or other Network devices’ SYSLOG and Event Log information without having to log into each individual device to see the same information.

Feature Spotlight: Transaction Check

Uptime’s transaction checks can continually monitor important functionality of your site. Specific steps within a Transaction Check can monitor nearly anything you have a test case for. So, this check is as good as the steps you configure for it. You can think of it as the first response or notification that a portion of critical infrastructure is down.

5 game-changing tips for automating your bug tracking in Jira Service Desk

Bug tracking is hard. Once more for your boss in the back. Bug tracking is hard! The support agent to developer handoff is a crucial yet an easily mishandled exchange. That’s bad news if you’re striving for low time-to-resolution targets and happy customers. Luckily, Atlassian and its app vendors provide an array of tools that can help you automate your bug resolution workflows to improve speed, consistency, and communication.