Operations | Monitoring | ITSM | DevOps | Cloud

uptime

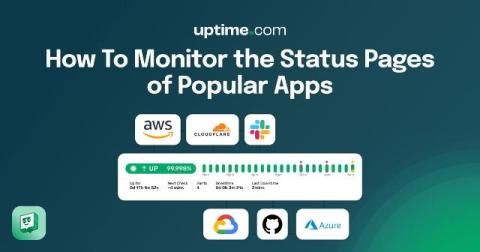
How To Monitor Status Pages of Popular Apps With Cloud Status

Remember the last time you noticed your app was acting weird, only to discover — after 30 minutes of debugging — that a critical service was down? We’ve all been there, frantically clicking through various status pages trying to figure out what’s broken, wishing you knew how to monitor status pages of your third party dependencies.

How To Monitor Website Performance: A Complete Guide for 2025

Picture this: Your marketing team just launched a major campaign, driving thousands of visitors to your website. The CEO is eagerly watching sales metrics, and your IT team has spent weeks optimizing the infrastructure. Then it happens — your website slows to a crawl. Cart abandonment spikes. Social media lights up with frustrated customers. And just like that, your big moment transforms into a costly nightmare. Sound familiar? You’re not alone.

What Is API Monitoring?

Application programming interfaces (APIs) are the James Bonds of software, silently keeping everything running smoothly while sipping martinis (shaken, not stirred). They’re the vital communication channels that enable different software systems to interact seamlessly, making sure your online shopping carts don’t mysteriously empty and your social media feeds keep you endlessly entertained with cat videos.

Enhancing Your Uptime.com Experience: New UI Updates and Functionality for 2025

At Uptime.com, we’re committed to delivering a seamless and efficient experience for our users. We’ve been listening to your feedback and are excited to share some significant updates to our platform. These improvements are designed to enhance usability, streamline workflows, and provide you with the tools you need to monitor and maintain your site’s reliability effectively. Let’s dive into the details!

An Uptime.com Year in Review

2024: The year of customer-driven innovation. At Uptime.com, 2024 marked a pivotal year of growth and transformation, driven by our unwavering commitment to customer feedback. With over 70 documented releases, we dedicated ourselves to delivering impactful features that enhance every aspect of our platform. From strengthening our infrastructure to refining the look and feel of our Status Pages, we’ve worked tirelessly to ensure our platform evolves alongside the needs of our users.

What Is Real User Monitoring (RUM)?

Even if your website is perfectly designed on paper, users don’t always follow the script. They often behave in ways you might never predict. Real user monitoring (RUM), also known as end-user experience monitoring or digital experience monitoring, closes that gap by providing a moment-to-moment view of user interactions. It allows you to spot where visitors encounter friction, confusion, or slowdowns that could impact conversions. These insights benefit your entire team.

Uptime.com's Real-Time Analysis Gets a Major Upgrade

At Uptime.com, we’re always looking for ways to empower our users with tools that enhance their ability to monitor website performance and ensure site reliability. That’s why we’re excited to announce a significant update to our Real-Time Analysis page. With this release, we’ve not only transitioned this critical feature to our cutting-edge NextGen infrastructure but also introduced several improvements to boost usability and performance. Here’s what’s new.

Introducing the Inspire Theme: A Fresh Look for Your Status Pages

We’re excited to announce the launch of our new Status Page theme: Inspire. This update brings a modernized design, enhanced customization options, and a sleek dark mode to elevate the way you communicate with your customers. See a live demo of the Inspire theme in action here.