Operations | Monitoring | ITSM | DevOps | Cloud

Latest Blogs

New Release: Public Status Page | Breakdown and Use Case

Uptime Status Pages can now be shared publicly. You will find that they are a useful tool for information sharing under a variety of circumstances. Internal pages offer excellent insight for your team, but public status pages provide users and other parties helpful information about your services and websites.

AppDynamics Enhances Pivotal Cloud Foundry Performance Monitoring with New Infrastructure View

We’ve significantly expanded our Pivotal Cloud Foundry (PCF) performance monitoring capabilities, adding an intuitive dashboard, new metrics, and advanced capabilities to deliver powerful insights into your PCF applications.

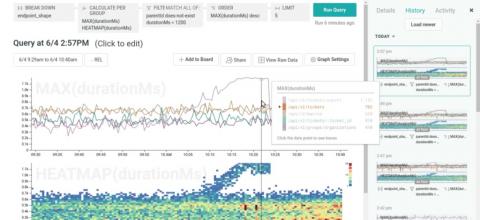
Using Trend Analysis for Better Insights

Centralized log collection has become a necessity for many organizations. Much of the data we need to run our operations and secure our environments comes from the logs generated by our devices and applications. Centralizing these logs creates a large repository of data that we can query to enable various types of analysis. The most common types are conditional analysis and trend analysis. They both have their place, but trend analysis is perhaps the more often underutilized source of information.

Log Management Comparison: ELK vs Graylog

Production logs can help ensure application security, reveal business insights and find and understand errors, crashes, and exceptions. But as useful as logs are, they’re difficult to manage and hard to keep track of. Making matters worse is that as log data volume grows, so does the difficult task of maintaining and managing them. It’s for this reason that developers, DevOps engineers, and CTOs turn to log management tools.

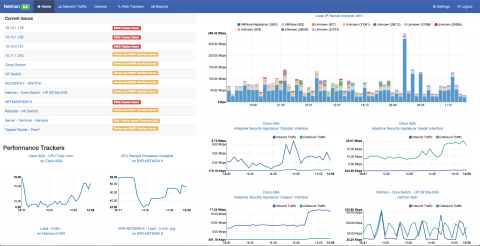
5 Critical Reasons for Network Traffic Analysis

As communication and network infrastructure grows in size and complexity, having a complete view and understanding of your network environment (including the amount and type of network traffic going back and forth) becomes vital to your business’ health and operations. Having the right tools to do the job is just as important. If you can’t quickly determine the source, destination, rate and the type of traffic going across the network, you don’t have the right tool.

Monitoring with Azure and Grafana

What is whitebox monitoring? Why do we monitor our systems? What is the Azure Monitor plugin and how can I use it to monitor my Azure resources? Recently, I spoke at Swetugg 2018, a .NET conference held in Stockholm, Sweden to answer these questions. In this video you’ll learn some basic monitoring principles, some of the tools we use to monitor our systems, and get an inside look at the new Azure Monitor plugin for Grafana.