Operations | Monitoring | ITSM | DevOps | Cloud

Latest News

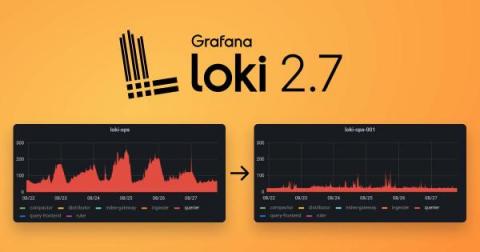
Grafana Loki 2.7 release: TSDB index, Promtail enhancements, and more

Grafana Loki 2.7 has arrived! With it comes an experimental feature we are rather excited about: a redesigned index based off of the Prometheus TSDB index. While we are still in the early stages, this enhancement in Grafana Loki, which we previewed at ObservabilityCON 2022, creates a smaller storage footprint, better query performance, and much more that we will dive into below!

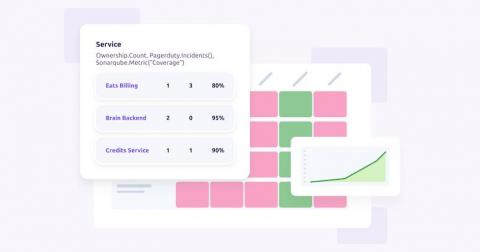
Introducing CQL reports

Reporting is essential when managing a microservice architecture. Without some kind of reporting tool, it’s significantly more difficult to gain insight into how services and resources are functioning. Software teams need this insight in order to make meaningful progress — without reporting, it’s hard to even know where progress needs to be made. With the introduction of CQL reports, Cortex gives you more visibility than ever before.

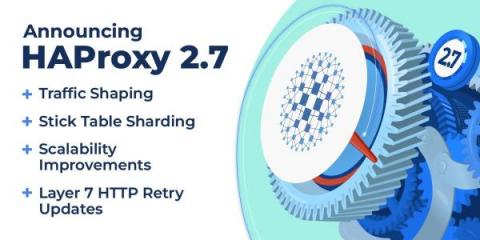
Announcing HAProxy 2.7 and HAProxy Enterprise 2.7r1

HAProxy 2.7 is now available! Register for the webinar HAProxy 2.7 Feature Roundup to learn more about this release and participate in a live Q&A with our experts. Once again, the latest HAProxy update features improvements across the board, upgrading old features and introducing some new ones. New elements in this release include: What a list!

Bringing Codecov into the Sentry Family: Where Code Coverage Meets Application Monitoring

Today Codecov is joining the Sentry family. Codecov began as a code coverage reporting tool in 2014 and has since emerged as a market leader in the test analytics space. Codecov makes coverage actionable for over two dozen test frameworks, and has helped over a million software developers improve their approach to testing, coverage, and code reliability. You might be asking, what do test analytics have to do with application monitoring?

Get in front of delivery risks by managing work in progress

Sleuth’s product team is pleased to announce an exciting new feature that provides early and actionable visibility into emerging work-in-progress risk! With this release, Sleuth provides customers even more actionable visibility into their engineering efficiency. It extends Sleuth's deploy-centric tracking capabilities upstream in the developer workflow to provide real-time visibility into in-flight work and its emerging risks. Here's how it works.

Logz.io's New Features: Easier, Faster, and More Cost-Efficient Observability

Our product strategy this year was relatively simple. Many observability practitioners we spoke with complained that observability was oftentimes slow, heavy, complex, and costly – which can be summed up in our CEO’s recent blog on modern observability challenges. While our customers didn’t report similar challenges, we wanted to further distance ourselves from this typical observability experience.

Network Performance Reporting Feature Release

Obkio’s long-awaited Network Performance Reporting feature is now available for all users of Obkio’s Network Monitoring App. Create custom network monitoring reports to simplify and visualize the analysis of information in your network. Learn more about how to access and use Network Performance Reporting with Obkio.

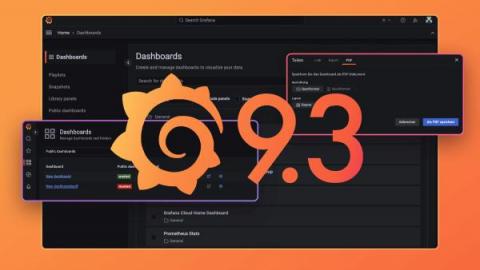
Grafana 9.3 release: Enhanced navigation, Grafana localization, Grafana Alerting updates, and more!

Welcome to Grafana 9.3! Get Grafana 9.3 In our continued efforts to make Grafana more accessible and easier to use, we are excited to showcase new updates to improve navigation, introduce localization, and much more. Read our What’s New documentation to learn all about the latest release and for more details, refer to the changelog.