Operations | Monitoring | ITSM | DevOps | Cloud

Latest Posts

Best Cloud Monitoring Tools (Open Source & More)

Cloud monitoring tools are utilized to gather an extensive range of metrics and logs from cloud resources and services. Some commonly monitored metrics include CPU utilization, memory usage, network traffic, disk I/O, latency, and response time. By monitoring these metrics, among others, it becomes possible to gain insights into resource utilization, identify performance bottlenecks, and ensure that the infrastructure operates according to expectations.

The Leading Use Cases For Data Monitoring

Generally, data monitoring can be referred to as a continuous process of observing and tracking data in order to ensure its integrity, quality, and conformance with specific standards or requirements. Data monitoring often involves systematic data collection, analysis, and reporting to identify patterns, trends, anomalies, and potential issues.

The Leading Open Source Dashboard Software

There are many advantages to using dashboards that are powered by open-source technology that make them a compelling choice for many organizations. Below we will discuss some of the major benefits of using dashboards that are built with the help of open-source technology, along with examples of some of the leading use cases for which open-source technology has been utilized.

The leading InfluxDB Dashboard Examples

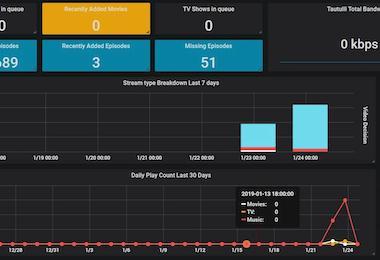
InfluxDB is a powerful tool for managing time-series data. It is widely used in industries such as IoT, finance, healthcare, and more. Using InfluxDB, you can query and store large amounts of data in real-time, making it easier to identify patterns, trends, and anomalies. InfluxDB dashboards provide a comprehensive overview of your system performance, metrics, and KPIs in real-time. You can customize these dashboards to meet your specific requirements.

The Latest Version of OpenSearch Is Now Live On Logit.io

Logit.io is pleased to introduce the latest version of OpenSearch onto the platform, with an OpenTelemetry-compliant data schema that unlocks a host of future analytics and observability capabilities. Also included in this release are improvements in threat detection for security analytics workloads, visualization tools, and machine learning (ML) models.

The Best Graphite Dashboard Examples

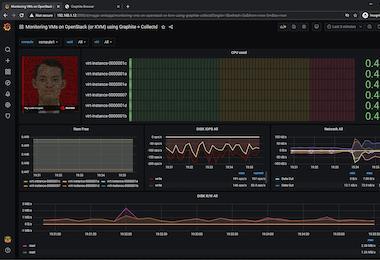
Graphite provides time-series metrics in an open-source database. With Graphite dashboards, you can see key performance indicators (KPIs) as well as other metrics visually. Dashboards typically display data as graphs, charts, and tables and can be customized to meet the specific needs of an organization. Using dashboards, organizations can monitor and analyze various aspects of their performance, such as system utilization, application performance, and resource utilization, using web interfaces.

The Best OpenSearch Dashboard Examples

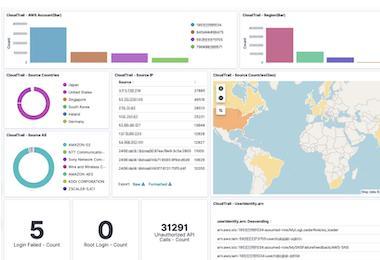
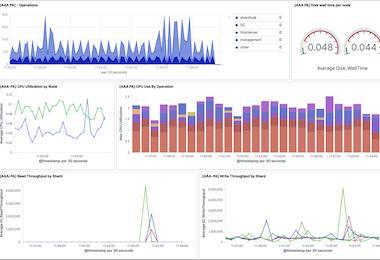
OpenSearch dashboards are a powerful tool for visualising and exploring data stored in an OpenSearch-compatible data store such as Elasticsearch. With OpenSearch's intuitive interface and advanced analytical tools, this visualisation tool makes it easy to gain insights into your data and monitor and alert upon key metrics. Throughout this article, we'll look at some of the most impressive OpenSearch dashboard examples that showcase it’s capabilities and versatility.

Kubectl Cheat Sheet

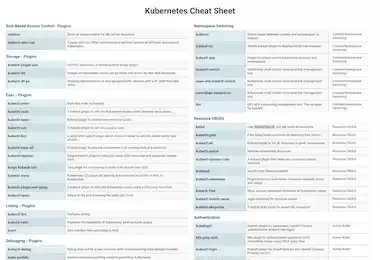
In the world of container orchestration, Kubernetes has become the de facto standard. Despite its simplicity in some respects, it has also introduced new levels of complexity in the deployment and management of distributed applications and services. To assist you with understanding the most common kubectl commands & plugins, we've created a cheat sheet as a reference for operations engineers, software engineers, and cloud infrastructure managers who use Kubernetes primarily.