Operations | Monitoring | ITSM | DevOps | Cloud

Latest Posts

Gartner IT IOCS Highlights: How Accenture Powers Automation Through Observability and StackState's 4T Data Model

Accenture’s vision for value-led, business-aligned operations applies Machine Learning, Automation and Observability to help cloud-hosted and on-premise systems diagnose and heal themselves. The company’s ubiquitous myWizard® platform, used by 100,000+ practitioners at more than 3000 companies, applies StackState’s advanced 4T Observability data model to improve service to Accenture’s customers.

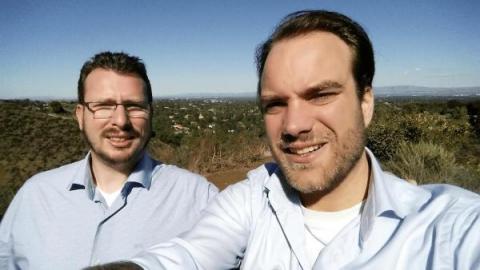
How it all began... - StackState's origin story

It’s 2014. A major Dutch bank is struggling with performance problems in highly visible customer-facing applications. These performance problems are proving to be incredibly difficult to resolve. It’s not that there’s no monitoring data that could potentially help. In fact, there’s tons of it, all nicely displayed in pretty dashboard after pretty dashboard.

Elastic and StackState Team Up to Pull Needles Out of Haystacks

Delivering great performance and reliability for your critical applications just keeps getting harder, doesn’t it? Between microservices, mercurial cloud resources, containers spinning up and down, distributed teams, specialized teams, and developers making changes, it’s an increasingly complex environment. With so many moving parts, if something goes wrong, how do you know what happened where, and what your environment looked like at the precise moment the problem began?

The Ultimate Guide To Telemetry

If you’re anywhere in the Queensland region of northern Australia, look out. There’s an eight-foot-nine-inch-long (2.65 meters) crocodile, deceptively named Danny-Boy, who might be looking for a snack. Specifically, if you’re anywhere near -12.975388, 141.987344, you should stay on your toes. That’s the last place Danny-Boy was sighted. So unless you want your pipes to be calling, keep your eyes peeled.

Investigating the Scene of an Incident: Using a Time-Traveling Topology to Create Escalation Graphs

Yes, time travel is possible...through data. My ability to time travel began when I started coding at age 10. Back then, all of my code ran on my own little computer. Like many ten-year-olds, I coded to create and play games. I also coded cool graphics to accompany music to impress my friends and utilities for copying. I launched my first commercial website in 1996 and made 25 guilders, which was good money for a 15-year old. Life was so easy.

Why the role of the CIO is constantly changing and challenging

Back in the days, the role of the CIO was relatively clear: the focus was on deploying, managing, and maintaining IT systems across the organization. The CIO’s responsibilities started to blur when end-users became more tech-savvy - around the millenium. Reasons were that ‘they can now get their own technology and don’t need IT to do it for them’. This even led to the much-repeated “death of the CIO meme”.

Top Observability Strategies for Distributed Systems

In a distributed IT environment, there are a lot of moving parts, and all of them need to be monitored to ensure everything is working as it should. The rise of more complex infrastructures interweaving the cloud, on-premises, and hybrid architectures makes this a challenge. To make sure you have adequate visibility, you need an IT observability strategy.

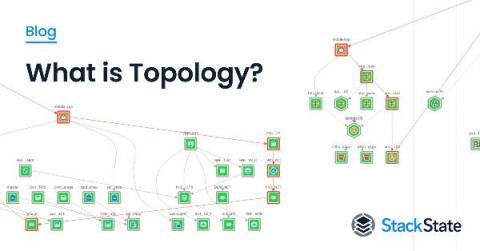
What Is Topology?

Topology is a multilayered map showing how everything in the IT environment is related. It's similar to Google Maps, which gives you a bird's eye view into an area and how everything is interconnected. Also, in Google Maps, you can see how traffic is flowing and which intersections may be causing bottlenecks. A view into topology allows similar visibility. You can see how components of an IT system are laid out to interact with each other.