Operations | Monitoring | ITSM | DevOps | Cloud

Latest Posts

Adding a Grafana Dashboard to Your Prometheus Setup

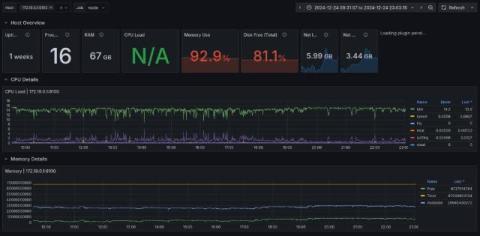
This article is part of a series on setting up an end-to-end monitoring and alerting stack using Prometheus. Continuing our series on setting Prometheus in a Docker container, we will add a Grafana instance to our Prometheus setup. Please refer to the previous article where we use docker compose to run Prometheus and Alertmanager together as that forms the basis to run multiple related containers. We will add a container to run Grafana to the same compose file in this article.

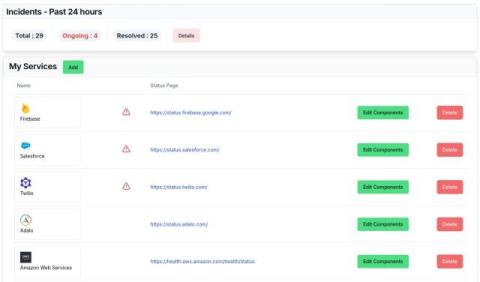
How To Decide Between Hosting Your Own Status Page Versus Using a Managed One

A status page forms a key part of your incident communication strategy. When it comes to setting up a status page, you have two options: We will examine the pros and cons of each option along these dimensions: For 1, if you choose a self-managed, open-source or custom solution, it's in your control. For a managed solution, you are limited by the provider's feature set. For 2, if you choose a self-managed solution, your team is responsible for the quality of the service.

Monitoring Security Vulnerabilities in Your Cloud Vendors

If you manage applications running on cloud platforms, you likely depend on multiple cloud vendors and services. These could be infrastructure providers like AWS, GCP or Azure. A vulnerability in any of these services could potentially impact your applications and your users. A cloud platform has many moving parts, many of which are dependent on other third-party providers.

Summarizing SRE/Ops Podcasts Using an LLM

There are plenty of good SRE/Ops related podcasts out there. I follow a few of them and listen to episodes whose titles sound interesting. The problem with podcasts is that some episodes focus on one topic, and other episodes deal with a host of topics. In between there is filler and things that are not relevant to the topic but are necessary to carry on a conversation. Spending 30-60 minutes listening to podcasts is not always a great use of time.

Sending Alerts Using Prometheus and Alertmanager

Continuing our series on setting up Prometheus in a container, this article provides a step-by-step guide for how to configure alerts in Prometheus. We will add alerting rules and deploy Prometheus Alertmanager with Slack integration. If you follow the steps in this article, you will end up with a containerized setup for: Let's get started.

Deploying Prometheus With Docker

There are different ways you can use to deploy the Prometheus monitoring tool in your environment. One of the fastest ways to get started is to deploy it as a Docker container. This guide shows you how to quickly set up a minimal Prometheus on your laptop. You can then extend that setup to add a monitoring dashboard, alerting, and authentication.

A Beginner's Guide To Service Discovery in Prometheus

Service discovery (SD) is a mechanism by which the Prometheus monitoring tool can discover monitorable targets automatically. Instead of listing down each and every target to be scraped in the Prometheus configuration, service discovery acts as a source of targets that Prometheus can query at runtime. Service discovery becomes crucial when there are dynamically changing hosts, especially in microservices architectures and environments like Kubernetes.