Operations | Monitoring | ITSM | DevOps | Cloud

Latest Posts

A Migration of 1000 Workloads Starts with a Single...

You’ve heard that old Chinese proverb that says a journey of a thousand miles begins with a single step. It’s sound advice … except if the journey you’re talking about is the one from the data center to the cloud. With cloud deployment at the center of virtually any digital transformation effort, the journey itself can have a profound impact on the successful outcomes you seek at the destination. So you have to get it right. But what does that actually mean?

Filling gaps in Kubernetes observability with the Sensu Kubernetes Events integration

Kubernetes and its various APIs offer a wealth of information for monitoring and observability. In a recent webinar with the CNCF (as well as a whitepaper based on that webinar), Sensu CEO Caleb Hailey goes in-depth into the most-useful APIs for cloud-native observability. In this post, we’ll focus on the Kubernetes Events API — including why it matters and how it can add context for your observability strategy.

VMware Tanzu SQL, Now GA for Kubernetes: A Consistent Postgres Experience Everywhere

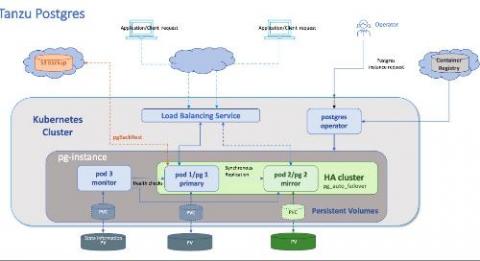
Data services—such as caches, messaging queues, and relational databases—are the backbone of applications. And when it comes to relational databases, Postgres is a pretty popular option. Its killer feature is its versatility. Natively and through plugins, Postgres supports a wide variety of data types, formats, and programming languages, which makes it useful for all kinds of applications, including text, geospatial, graph, and more.

InfluxData advances possibilities of time series data with general availability of InfluxDB 2.0

SAN FRANCISCO — November 10, 2020 — InfluxData, creator of the time series database InfluxDB, today announced the general availability of the next-generation open source platform for time series data, InfluxDB 2.0. Developers can now ingest, query, store and visualize time series data in a single unified platform, leverage new tools and integrations, and use familiar skills — making it faster and easier than ever to develop and deploy modern time-based applications.

InfluxDB 2.0 Open Source is Generally Available

Today, we are proud to announce that InfluxDB Open Source 2.0 is now generally available for everyone. It’s been a long road, and we couldn’t have done it without the amazing support and contributions of our community. This marks a new era for the InfluxDB platform, but it truly is just the beginning. Before we talk about the future, let’s take a look at some of the amazing new capabilities our team has been working on.

CybersecAsia Awards 2020 recognizes ManageEngine for its leadership in cybersecurity

ManageEngine’s Log360 was recently honored with the CybersecAsia Award for the Best User and Entity Behavior Analytics software application. The award certifies the important role, and the innovative technology brought to the table by Log360 over the past two years. Elevated cybersecurity risks currently experienced by organizations have driven the sudden adoption of the cloud and increased workforce mobility.

Generate process metrics to analyze historical trends in resource consumption

Your application’s health depends on the performance of its underlying infrastructure. Unexpectedly heavy processes can deprive your services of the resources they need to run reliably and efficiently, and prevent other workloads from executing. If one of your applications is triggering a high CPU or RSS memory utilization alert, the issue has likely occurred before.

Getting Started with Sematext Browser SDK for Front-end Performance Monitoring

Open-sourcing a code base for the world to see after working on it for a long time is a great experience. You should care about what your users want. You want your users to have a great experience using your product. Everything has to fall into place. Performance, responsiveness, user experience, etc. all have to be exceptional. That’s why I think front-end performance metrics are crucial.

Trace discovery in Grafana Tempo using Prometheus exemplars, Loki 2.0 queries, and more

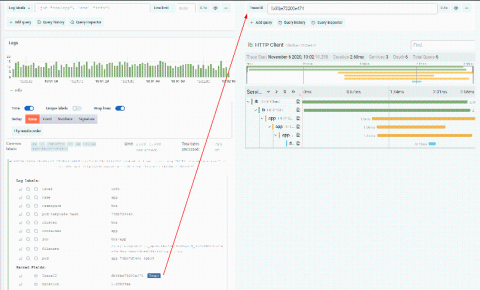
Grafana Tempo, the recently announced distributed tracing backend, relies on integrations with other data sources for trace discovery. Tempo’s job is to store massive numbers of traces, place them in object storage, and retrieve them by id. Logs and exemplars allow users to quickly and more powerfully jump directly to traces than ever before. Let’s dig into some examples with a live playground to try it out!

How to Minimise your Azure Blob Storage Costs

We all know that while Microsoft provides an almost seemingly infinite amount of storage. Compare this to your normal datacentre virtual infrastructure, you often need to do some capacity planning for expected Virtual Machine Compute and Storage way ahead of time. As Microsoft does the capacity planning for you (and everyone else who is using their services), your own Operational Support no longer needs to order disks or more servers to keep up with your business growth and expectations.