|
By Aaron Kaplan
Amazon MemoryDB for Redis is a highly durable in-memory database service that uses cross-availability-zone data storage and fast failover, providing microsecond read times and single-digit-millisecond write times. Datadog’s integration for MemoryDB uses a range of metrics to provide important visibility into MemoryDB performance.
|
By Aaron Kaplan
Understanding costs is an essential part of service ownership. But in cloud-based applications, the cost of any given service often comes down to a wide range of dynamic factors. Individual services can incur fees from numerous dependencies, from data stores to observability solutions, and keeping track of these expenses can mean reckoning with the intricacies of many different billing models.
|
By Candace Shamieh
Today’s distributed IT infrastructure consists of many services, systems, and applications, each generating logs in different formats. These logs contain layers of important information used for data analytics, security monitoring, and application debugging. However, extracting valuable insights from raw logs is complex, requiring teams to first transform the logs into a well-known format for easier search and analysis.
|
By Florian Engelhardt
A few months ago, we implemented support for exception profiling in PHP. One of the key justifications for building this functionality into Continuous Profiler was to show the hidden costs of exceptions in PHP, especially when they are used for flow control in hot code paths. Once this feature was built, we naturally wanted to know if it surfaced these kinds of flow control problems in customer production systems.
|
By Tom Sobolik
The proliferation of managed LLM services like OpenAI, Amazon Bedrock, and Anthropic have introduced a wealth of possibilities for generative AI applications. Application engineers are increasingly creating chain-based architectures and using prompt engineering techniques to build LLM applications for their specific use cases.
|
By Nicholas Thomson
Widespread adoption of containerized infrastructure has been closely followed by an explosion of container-native tools for each layer of the stack, including new solutions for managing CI/CD pipelines in container-based environments, such as the Argo suite, FluxCD, and Tekton. This is because these lightweight solutions make it easier to automate builds, testing, deployments, and more on Kubernetes, as well as other platforms that manage containerized workloads and services.
|
By Candace Shamieh
Alert storms occur when your monitoring platform generates excessive alerts simultaneously or in succession. Although numerous factors can cause an alert storm, microservices architectures are uniquely susceptible to them due to multiple service dependencies, potential failure points, and upstream and downstream service relationships.
|
By Othmane Abou-Amal
Foundation models, or large AI models, are the driving force behind the advancement of generative AI applications that cover an ever-growing list of use cases including chatbots, code completion, autonomous agents, image generation and more. However, when it comes to understanding observability metrics, current large language models (LLMs) are not optimal.
|
By Claire Laurence
DASH 2024 was our biggest event yet! Over two days, thousands from the Datadog community gathered at North Javits in New York City for an impactful experience. The 2024 keynote featured numerous new product launches and updates, but there was much more to enjoy beyond this speech. Attendees got to experience breakout sessions, workshops, certification exams, one-on-one Datadog consultations, and a bustling expo hall.
|
By Shanel Huang
The Teleport Access Platform delivers on-demand, least-privileged access to infrastructure (for SSH, Kubernetes, RDP, Web, databases, and clouds) on a foundation of cryptographic identity and zero trust, which eliminates the attack surfaces of both shared secrets and standing privileges.
|
By Datadog
Connor Teague, Greenlight Gabby Luna, Greenligt.
|
By Datadog
Learn how to monitor your AWS infrastructure with Datadog and HCP Terraform in our interactive lab. Gain hands-on experience with configuring monitoring and managing your infrastructure as code!
|
By Datadog
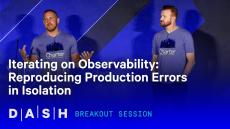
Jeremy Brett, Charter Communications Robert Gladmon, Charter Communications.
|
By Datadog
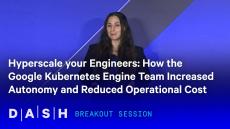
Ayelet Sachto, Google.
|
By Datadog
In this video we’ll continue our look at the details of how Kubernetes secures the various APIs it uses, looking at the controller manager, scheduler, and Kube proxy APIs. For more information, please see our security labs blog Kubernetes security fundamentals: API Security.
|
By Datadog
As companies rapidly adopt Large Language Models (LLMs), understanding their unique challenges becomes crucial. Join us for a special episode of "Datadog On LLMs: From Chatbots to Autonomous Agents," streaming directly from DASH 2024 on Wednesday, June 26th, to discuss this important topic. In this live session, host Jason Hand will be joined by Othmane Abou-Amal from Datadog’s Data Science team and Conor Branagan from the Bits AI team. Together, they will explore the fascinating world of LLMs and their applications at Datadog.
|
By Datadog
DASH is an annual conference about building and scaling the next generation of applications, infrastructure, security, and technical teams.
|
By Datadog
As organizations increasingly leverage generative AI in their applications, ensuring end-to-end observability throughout the development and deployment lifecycle becomes crucial. This webinar showcases how to achieve comprehensive observability when deploying generative AI applications on AWS using Amazon Bedrock and Datadog.
|
By Datadog
Learn effective strategies for navigating automation and cost management in connected vehicle ecosystems with Rivian's Senior Engineering Manager, Beau Christensen, at DASH 2024.
|
By Datadog
DASH is Datadog’s annual conference, with two days packed with hands-on learning and inspiration. Let’s build and scale the next generation of applications, infrastructure, security, and teams together.
|
By Datadog
As Docker adoption continues to rise, many organizations have turned to orchestration platforms like ECS and Kubernetes to manage large numbers of ephemeral containers. Thousands of companies use Datadog to monitor millions of containers, which enables us to identify trends in real-world orchestration usage. We're excited to share 8 key findings of our research.
|
By Datadog
The elasticity and nearly infinite scalability of the cloud have transformed IT infrastructure. Modern infrastructure is now made up of constantly changing, often short-lived VMs or containers. This has elevated the need for new methods and new tools for monitoring. In this eBook, we outline an effective framework for monitoring modern infrastructure and applications, however large or dynamic they may be.
|
By Datadog
Where does Docker adoption currently stand and how has it changed? With thousands of companies using Datadog to track their infrastructure, we can see software trends emerging in real time. We're excited to share what we can see about true Docker adoption.
|
By Datadog
Build an effective framework for monitoring AWS infrastructure and applications, however large or dynamic they may be. The elasticity and nearly infinite scalability of the AWS cloud have transformed IT infrastructure. Modern infrastructure is now made up of constantly changing, often short-lived components. This has elevated the need for new methods and new tools for monitoring.
|
By Datadog
Like a car, Elasticsearch was designed to allow you to get up and running quickly, without having to understand all of its inner workings. However, it's only a matter of time before you run into engine trouble here or there. This guide explains how to address five common Elasticsearch challenges.
|
By Datadog
Monitoring Kubernetes requires you to rethink your monitoring strategies, especially if you are used to monitoring traditional hosts such as VMs or physical machines. This guide prepares you to effectively approach Kubernetes monitoring in light of its significant operational differences.
- July 2024 (14)
- June 2024 (25)
- May 2024 (12)
- April 2024 (19)
- March 2024 (11)
- February 2024 (21)
- January 2024 (19)
- December 2023 (18)
- November 2023 (22)
- October 2023 (15)
- September 2023 (14)
- August 2023 (28)
- July 2023 (15)
- June 2023 (17)
- May 2023 (22)
- April 2023 (13)
- March 2023 (22)
- February 2023 (12)
- January 2023 (8)
- December 2022 (9)
- November 2022 (27)
- October 2022 (22)
- September 2022 (14)
- August 2022 (21)
- July 2022 (13)
- June 2022 (13)
- May 2022 (18)
- April 2022 (14)
- March 2022 (6)
- February 2022 (14)
- January 2022 (17)
- December 2021 (9)
- November 2021 (16)
- October 2021 (26)
- September 2021 (8)
- August 2021 (18)
- July 2021 (15)
- June 2021 (16)
- May 2021 (23)
- April 2021 (20)
- March 2021 (16)
- February 2021 (9)
- January 2021 (10)
- December 2020 (22)
- November 2020 (17)
- October 2020 (12)
- September 2020 (15)
- August 2020 (22)
- July 2020 (20)
- June 2020 (14)
- May 2020 (18)
- April 2020 (24)
- March 2020 (13)
- February 2020 (13)
- January 2020 (11)
- December 2019 (16)
- November 2019 (11)
- October 2019 (11)
- September 2019 (11)
- August 2019 (16)
- July 2019 (18)
- June 2019 (11)
- May 2019 (12)
- April 2019 (20)
- March 2019 (10)
- February 2019 (9)
- January 2019 (6)
- December 2018 (7)
- November 2018 (7)
- October 2018 (13)
- September 2018 (5)
- August 2018 (12)
- July 2018 (12)
- June 2018 (6)
- March 2018 (1)
- December 2017 (1)
- November 2017 (1)
Datadog is the essential monitoring platform for cloud applications. We bring together data from servers, containers, databases, and third-party services to make your stack entirely observable. These capabilities help DevOps teams avoid downtime, resolve performance issues, and ensure customers are getting the best user experience.
See it all in one place:
- See across systems, apps, and services: With turn-key integrations, Datadog seamlessly aggregates metrics and events across the full devops stack.
- Get full visibility into modern applications: Monitor, troubleshoot, and optimize application performance.
- Analyze and explore log data in context: Quickly search, filter, and analyze your logs for troubleshooting and open-ended exploration of your data.
- Build real-time interactive dashboards: More than summary dashboards, Datadog offers all high-resolution metrics and events for manipulation and graphing.
- Get alerted on critical issues: Datadog notifies you of performance problems, whether they affect a single host or a massive cluster.
Modern monitoring & analytics. See inside any stack, any app, at any scale, anywhere.


