Operations | Monitoring | ITSM | DevOps | Cloud

Latest Posts

Stay ahead of service disruptions with Watchdog Cloud & API Outage Detection

Even with the best monitoring in place, outages are unavoidable. Complex, modern IT environments rely on multiple third-party services, including critical cloud and API providers, and when any one of those goes down, it can trigger a domino effect of increased error rates and latency spikes across your system. And, because you don’t have as much visibility into external services, it can be difficult to identify that the problem is due to an outside outage or disrupted service.

Enrich your on-call experience with observability data at your fingertips by using Datadog On-Call

The stress, sudden disruptions, and high stakes of resolving issues while on call is one of the most challenging aspects of an engineer’s job. Many organizations, from startups to large enterprises, still struggle with their on-call experience, which leads to longer resolution times and lower employee retention rates. Constant context switching, managing multiple tools, and racing against time to resolve issues can cause frustration, burnout, and inefficiency.

Improve database host and query performance with Database Monitoring Recommendations

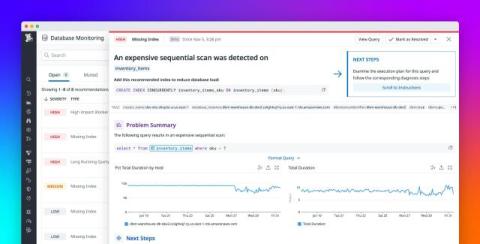
Modern applications rely on databases, making database performance and reliability essential. As systems grow in scale and complexity, identifying the impact and addressing the root causes of database performance issues—such as long query durations or missing indexes—becomes increasingly challenging. Datadog Database Monitoring (DBM) Recommendations address these challenges by providing a clear, prioritized view of performance bottlenecks.

Monitor Cloud Run with Datadog

In part 1 of this series, we introduced the key Cloud Run metrics you should be monitoring to ensure that your serverless containerized applications are reliable and can maintain optimal performance. In part 2, we walked through a couple of Google Cloud’s built-in monitoring tools that you can use to view those key metrics and check on the health, status, and performance of your serverless containers.

How to collect Google Cloud Run metrics

In Part 1 of this series, we looked at key Cloud Run metrics you can monitor to ensure the reliability and performance of your serverless containerized workloads. We’ll now explore how you can access those metrics within Cloud Run and Google’s dedicated observability tool, Cloud Monitoring. We’ll also look at several ways you can view and explore logs and traces in the Cloud Run UI and Google Cloud CLI.

Key metrics for monitoring Google Cloud Run

Google Cloud Run is a fully managed platform that enables you to deploy and scale container-based serverless workloads. Cloud Run is built on top of Knative, an open source platform that extends Kubernetes with serverless capabilities like dynamic auto-scaling, routing, and event-driven functions. By using Cloud Run, developers can simply write and package their code as container images and deploy to Cloud Run—all without worrying about managing or maintaining any underlying infrastructure.

Accelerate root cause analysis with Watchdog and Faulty Kubernetes Deployment

Understanding and managing the impact of Kubernetes changes is one of the biggest challenges for modern DevOps teams. Every modification to a manifest, whether it’s adjusting memory limits, tweaking CPU allocations, or updating container images, has the potential to destabilize services or degrade performance.

Investigate memory leaks and OOMs with Datadog's guided workflow

Containerized application crashes due to exceeding memory limits are often tricky to investigate as they can be caused by different underlying issues. A program might not be freeing memory properly, or it might just not be configured with appropriate memory limits. Investigation methods also differ based on the language and runtime your program uses.

Unlock advanced query functionality with distribution metrics

As organizations break down monolithic applications in favor of a more distributed, microservices-based architecture, they need to collect increasing amounts of metric data. But how do you summarize this data to provide insights at scale? Averages are simple to calculate but can be misleading, especially for increasingly complex and distributed environments that contain outlier values that skew the average.