Operations | Monitoring | ITSM | DevOps | Cloud
Latest Posts
Announcing Streama: Get complete monitoring coverage without paying for the noise
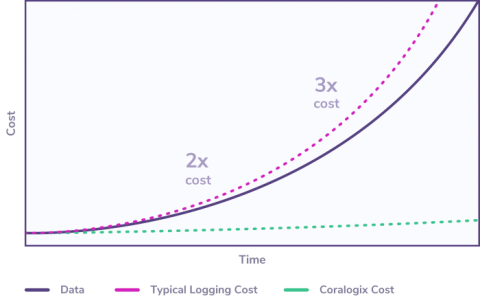
With the new Streama capability announced today, you no longer have to choose what to monitor and what to drop to manage your logging costs. For years, our customers have enjoyed the benefits of a log analytics platform that enables them to autonomously manage and analyze data in their cloud applications. Our machine learning engine empowers users to improve their system stability and accelerate their release cycles.
Gain Better Visibility into Kubernetes Cost Allocation
Adopting Kubernetes and service-based architecture can bring many benefits to organizations – teams move faster and applications scale more easily. However, visibility into cloud costs is made more complicated with this transition. This is because applications and their resource needs are often dynamic, and teams share core resources without transparent prices attached to workloads.
Using the Prune Filter in Logstash
Logstash has a number of helpful plugins. We’ve covered the mutate plugin in great detail here, as well as Logstash grok, but it was time to go over some of the others. Here, the Logstash Prune Filter will get its due attention. Its existence owes to the need to remove fields according to select blacklists or whitelists of field names and their associated values. Put more curtly, it prunes the excess branches (fields) in your garden (your data).
ELK Stack: 5 Common ELK Issues and How to Fix Them
Running an ELK stack provides unrivaled benefits for your organization, however, ELK issues will inevitably crop up. ELK is scalable, and largely agnostic of internal infrastructure, making it a great asset for SMEs and enterprises. However, successfully deploying and running an ELK stack is not without its difficulties. In order to keep your ELK stack running at optimum performance, you need to familiarize yourself with some of the most common ELK issues.
Troubleshooting your apps with Cloud Logging just got a lot easier
In Cloud Logging, we understand that logging is a critical part of what it takes for you to operate reliable applications and infrastructure on Google Cloud. We’ve added new features to help you more easily store, find and control your logs. Today, we’re announcing a new default logging experience: Logs Explorer. Previously known as Logs Viewer Preview, Logs Explorer provides new tools for you to better understand and analyze your logs during the troubleshooting process.
Introducing Puppet Enterprise tasks and workflows in Puppet Remediate
Today we are pleased to announce the release of Puppet Remediate 1.4. This release brings together the dynamic vulnerability data and prioritization capabilities in Puppet Remediate with Puppet Enterprise’s industry-leading automation to help organizations improve their security posture and reduce the risk of security incidents.
Now you can add Amazon Timestream to your Grafana observability dashboard
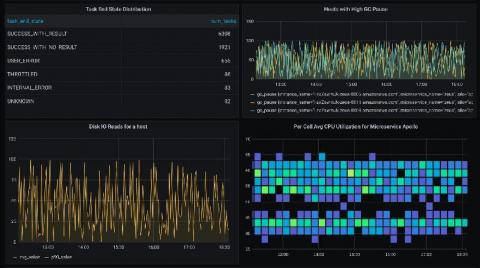
Today, AWS launched Amazon Timestream, a fast, scalable, serverless time series database purpose-built for IoT use cases. If you’re looking into trying out Timestream, know that you can visualize the native Timestream queries with Grafana out of the box. Here are some examples of the robust, SQL-style Timestream queries visualized in Grafana.
Is your microservice a distributed monolith?
Your team has decided to migrate your monolithic application to a microservices architecture. You’ve modularized your business logic, containerized your codebase, allowed your developers to do polyglot programming, replaced function calls with API calls, built a Kubernetes environment, and fine-tuned your deployment strategy. But soon after hitting deploy, you start noticing problems.
Microsoft Login Failures Affecting Office 365 and Azure
On Monday, September 28th 2020, Microsoft had a failure with their authentication system that affected major products and services such as Office 365, Outlook, Teams, Sharepoint, Azure and many others. The Microsoft login failure affected consumer and business users that were not already authenticated with the Azure Active Directory (Azure AD) service. Microsoft confirmed the outage on their Azure Status Dashboard website.


