Operations | Monitoring | ITSM | DevOps | Cloud

Latest Posts

9 Signs Your Cloud Readiness Isn't What It Needs to Be

Yes, everyone is talking about the cloud, but are they actually ‘doing it’? The short answer is yes, and in stunning numbers. According to a recent O’Reilly survey, 90+% of organizations expect to increase their usage of cloud-based infrastructure. Over the next 12 months, 67% expect to shift half or more of their applications to the cloud, and 45% are planning to move three-quarters or more of their apps.

How to Create SQL Percentile Aggregates and Rollups With Postgresql and t-digest

When it comes to data, let’s start with the obvious. Averages suck. As developers, we all know that percentiles are much more useful. Metrics like P90, P95, P99 give us a much better indication of how our software is performing. The challenge, historically, is how to track the underlying data and calculate the percentiles. Today I will show you how amazingly easy it is to aggregate and create SQL based percentile rollups with Postgresql and t-digest histograms!

Getting Started: Writing Data to InfluxDB

This is a beginner’s tutorial for how to write static data in batches to InfluxDB 2.0 using these three methods. Before beginning, make sure you’ve either installed InfluxDB OSS or have registered for a free InfluxDB Cloud account. Registering for an InfluxDB Cloud account is the fastest way to get started using InfluxDB.

Getting Started: Streaming Data into InfluxDB

This is Part Two of Getting Started Tutorials for InfluxDB v2. If you’re new to InfluxDB v2, I recommend first learning about different methods for writing static data in batches to InfluxDB v2 in Part One of this Getting Started series. This is a beginner’s tutorial for how and when to write real-time data to InfluxDB v2. The repo for this tutorial is here. For this tutorial, I used Alpha Vantage’s free “Digital & Crypto Currencies Realtime” API to get the data.

How to "Translate" Grafana Dashboards from Prometheus to Elasticsearch

In the field of open-source metrics and time series monitoring, it is quite clear today that Grafana is the most popular tool of choice. One of Grafana’s main advantages is its storage backend flexibility. It can support almost all the major time series datastores (Prometheus, InfluxDB, Elasticsearch, Graphite etc.), when each datastore has its own query language syntax, and slight differences in the actual Grafana UI and capabilities resulting from these differences.

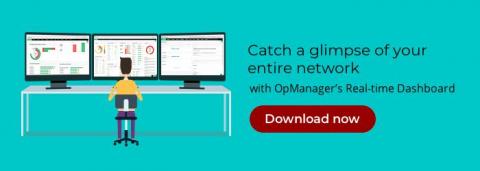
Get a live view of network performance with OpManager's Real-time Dashboard

Although network monitoring is an unenviable task, it must be done to sustain your network’s health. But what if you had a real-time report containing only key metrics, revealing how your network is doing without overloading you with information? This would (1) assure you that there are no aberrations in your network and (2) give you peace of mind.

Monitoring Apache Web Server with Bleemeo

The Apache HTTP server commonly known as Apache was officially released in 1995. Nowadays is one of the most popular HTTP servers on the World Wide Web. Many organizations such as Facebook, Cisco, IBM, and of course Apache Software foundation itself uses it. It's an open source web server, maintained by Apache Software Foundation. Apache is a cross-platform, even if the vast majority of server instances runs on Linux but some version also run on Windows.

The No. 1 Rule of Disaster Recovery

Let’s imagine you are running a hosting shop with highly visible production applications. Your team has backups, and you have a disaster recovery (DR) policy. You think you are ready to handle any real-world scenario in addition to checking all your compliance boxes. Your third-party backup tools are creating backups, and your implemented solutions have a brochure indicating restore capability.

Jaeger Essentials: Best Practices for Deploying Jaeger on Kubernetes in Production

Logs, metrics and traces are the three pillars of the Observability world. The distributed tracing world, in particular, has seen a lot of innovation in recent months, with OpenTelemetry standardization and with Jaeger open source project graduating from the CNCF incubation. According to the recent DevOps Pulse report, Jaeger is used by over 30% of those practicing distributed tracing.