Operations | Monitoring | ITSM | DevOps | Cloud

Latest Posts

Repeated Office 365 Outages, November 2019

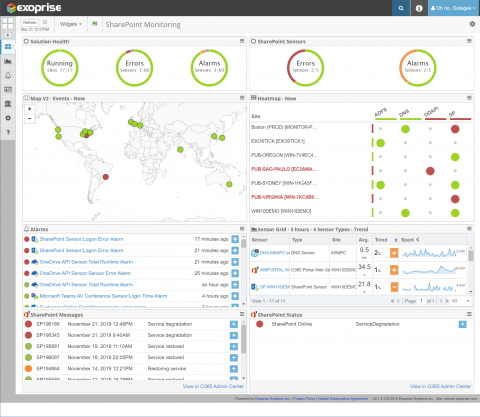
Microsoft 365 including Office 365 has been suffering repeated outages over the past few days. Between Tuesday November 19th and Thursday November 21 2019 (so far), there have been repeated outages, timeouts and problems with SharePoint, OneDrive and various parts of Azure AD (AAD). Exoprise customers, of course, have known about these Microsoft 365 outages well in advance of getting notifications from Microsoft.

Announcing Datadog Security Monitoring

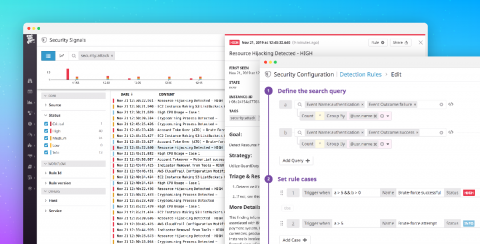
With the growing complexity and velocity of security threats in dynamic, cloud-native environments, it’s more important than ever for security teams to have the same visibility into their infrastructure, network, and applications that developers and operations do. Conversely, as developers and operations become responsible for securing their services, they need their monitoring platform to help surface possible threats.

SCOM 2019: What's next

"Who doesn't love monitoring?" said no one ever. Well, no one but me. Seriously. I love monitoring, but oftentimes I felt like I was the only one. After 23 years at Purdue University I decided that it was time to change things up, try something new, and start looking to see if monitoring could be fun, interesting, and actually creative for someone other than myself. Surprisingly for me, SquaredUp was also interested in the same thing!

Customize Your Sentry Workflow: A Sample Internal Integration

This year we introduced the Sentry Integration Platform, which allows 3rd-party developers to build integrations that connect Sentry with their software. More recently we launched Internal Integrations, which lets developers combine Sentry with their internal tools to support their own custom workflows.

[PromCon Recap] Two Households, Both Alike in Dignity: Cortex and Thanos

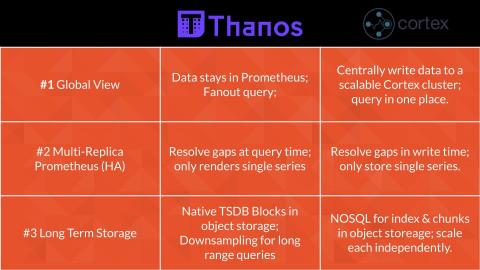
This blog post is a writeup of the presentation Bartek Plotka and I gave at PromCon 2019. Cortex is a horizontally scalable, clustered Prometheus implementation aimed at giving users a global view of all their Prometheus metrics in one place, and providing long term storage for those metrics. Thanos is newer project aimed at solving the same challenges. In this blog post, we compare these two projects and see how it is possible to have two completely different approaches to the same problems.

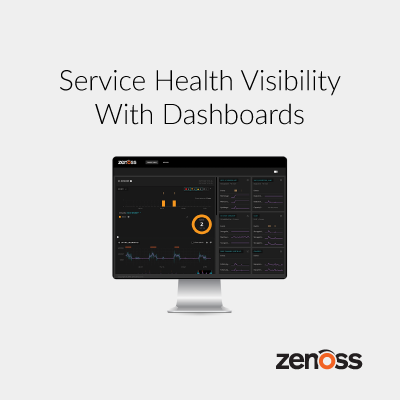
Service Health Visibility With Dashboards

It is increasingly clear that tools developed to keep a single system or a small cluster running are no longer sufficient in today’s highly distributed, complex environment. The tools that offer service assurance must be able to move their way through complex application systems and prevent slowdowns or application failures. These complex systems now include physical systems, virtual systems and even systems found in a cloud service provider’s data center.

Predictive Analytics to Improve Decision Making

Predictive analytics for networks are helping businesses optimize their network performance, anticipate network capacity related requirements, and eventually forecast future much more efficiently than ever. Gartner has estimated the value of network monitoring software market at roughly $2.1 Billion, this figure is presently increasing at a growth rate of 15.9% annually. The demand for predictive analytics in network monitoring software has grown beyond enterprises and datacentres.

A Brief Introduction to Containers

Whether you’re new to development or a seasoned developer, containers have proven to be game-changing in building, testing, and deploying applications. This article is meant as a quick introduction to the world of containers. To get started, you’ll need to install Docker to follow along with the examples. If you haven’t installed Docker yet, head over to their website to get it installed. There are free versions available for all major operating systems.

Super-Size Your Log Searches

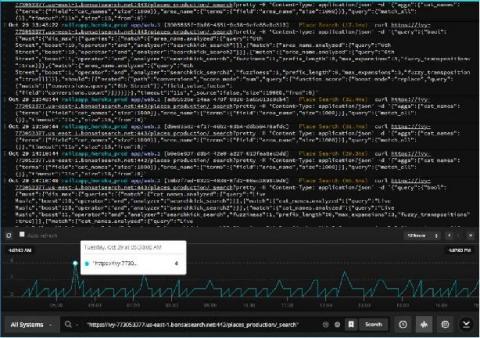
At SolarWinds® Papertrail™, we know that when you’re combing through lines and lines of long event messages, every pixel matters. That’s why in the new Papertrail event viewer, we introduced the ability to hide the application chrome. Hiding the application chrome, or ‘presentation mode,’ removes the header and navigation menus and maximizes your screen real estate. So far the feedback on this new option has been great.