Operations | Monitoring | ITSM | DevOps | Cloud

Latest Posts

Five reasons to choose Log360, part 3: Comprehensive network auditing

In the previous post, we discussed the various environments that Log360 helps you audit and secure. Having established the ease of Log360’s use and the breadth of its auditing scope, now we’ll examine some of the critical areas it can help you monitor. With over 1,000 predefined reports and alerts for several crucial types of network activity, Log360 provides comprehensive network auditing.

Magecart Monthly: Record £183m fine for British Airways.

Read the latest news on Magecart attacks! We’ve trawled the web for the latest news of data breaches, including updates on previous attacks. Now featuring insider insights from our own Security Researcher! Latest attacks: New! Major Attack on US Medical Debt Collection company American Medical Collection Agency (AMCA). Their payment portal was compromised for 8 months from August 1st, 2018 to March 30th, 2019.

A Closer Look at Lazy Loading Grafana Dashboards

Lazy loading of dashboard panels has been a popular feature request from the Grafana community for many years, and it was finally added in v6.2. In previous versions, the moment you opened a dashboard Grafana will issue queries for every panel, even those you have to scroll to see. This can create high peaks in load to your data source backends. Meanwhile, you may never actually scroll down to look at all of those panels, so executing queries for those panels would have been pointless.

Surfer - SEO Analytics and Data on your plate

SEO is an important aspect of web and the growing trend of Internet shopping has made SEO an essential aspect to achieve success in any online endeavors. We live in a modern age where our digital world surpasses our physical one and just having a basic understanding of it is not going to take you anywhere.

How to set up multiple environments in LogDNA

The use cases and requirements of a logging platform in an organization varies between teams and job functions. The problem isn’t in collecting log data (we are a logging company after all), but in deciding how to manage these logs for each team. For example, our backend developers need detailed, short-lived logs in order to build and test new features; while our infrastructure team needs lengthy retention periods for auditing and compliance.

Logstash Tutorial: A Quick Getting Started Guide

Looking to learn about Logstash as quickly as possible? This Logstash Tutorial is for you: we’ll install Logstash and push some Apache logs to Elasticsearch in less than 5 minutes. Logstash is a good (if not the) swiss-army knife for logs. It works by reading data from many sources, processing it in various ways, then sending it to one or more destinations, the most popular one being Elasticsearch.

CI/CD Tools for Cloud Applications on Kubernetes

Kubernetes is the de facto industry standard for container management and orchestration. Not surprisingly, it has also become common to use Kubernetes in tandem with compatible Continuous Integration (CI) and Continuous Deployment (CD) tools. As a container orchestrator, Kubernetes expects deployments to spin up software throughout a cluster. Those deployments are created using files or command lines that can be generated manually or using properly configured CI/CD software.

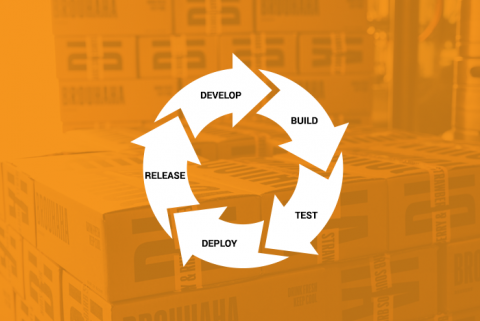
Continuous Deployment Tools

July 05, 2019 Software development has changed rapidly over the last ten years. Many companies have moved away from the traditional waterfall development model to an agile methodology, and this has meant embracing continuous integration and continuous delivery practices. But how about taking it one step further with continuous deployment? Are you deploying to production automatically, without any human intervention? Some of the major products we rely on everyday are.