Operations | Monitoring | ITSM | DevOps | Cloud
Latest Posts
7 ways to speed up your build cycle
Few things have more potential for causing stress within software teams than a defective build cycle. Each of us remembers the first time in our careers when our code broke the build. For many of us, there’s still a sigh of relief at each step in the process when nothing blows up. In a perfect world, where we’d all write flawless code with 100% test coverage, builds would be stressless, boring affairs.
Happy National Cybersecurity Awareness Month!
October is the month of spooky scares, so it makes sense that National Cybersecurity Awareness Month is also recognized at this time—after all, what’s more scary than, for example, having someone phish for your personal information and using said info to ruin your credit or losing your password to hackers so they have access to your bank account?
Web browser security. Is it really safe?
If there is still a reason why you have a post-it covering the webcam of your laptop, if you have not yet had the audacity to delve into the deep web despite all the mysteries they say it contains, if you only enter the Internet in incognito mode, sitting in your armchair with a blindfold: then you’re worried about one thing: safety. Today, in our blog, we will discuss Web browser security. Which are the safest? Is there life beyond Google Chrome?
What's Next for Observability
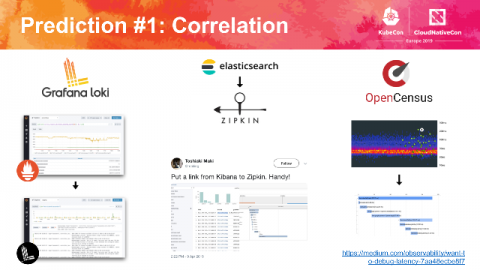
In the industry, the long-held theory behind observability is that a successful stack consists of three key components – metrics, logging, and tracing. “This is a mental model for people who are often new to observability which helps them get a handle on what they need to implement to be successful,” said Grafana Labs VP of Product Tom Wilkie during a keynote presentation he delivered at KubeCon + CloudNativeCon EU in May alongside Red Hat Software Engineer Frederic Branczyk.
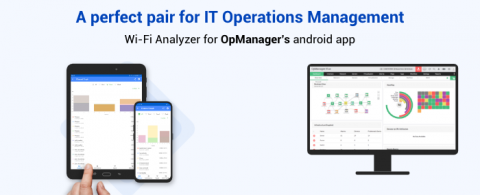
Introducing the Wi-Fi Analyzer for OpManager's Android app: A perfect team for sustained IT infrastructure management
Addressing Wi-Fi issues can be challenging Tracking the availability, speed, and performance of a large number of systems, servers, VMs, routers, access points, firewalls, interfaces, and WAN links, plus monitoring their health is not a simple task. Tackling angry emails from employees about Wi-Fi running slowly, or it taking a lifetime to download a simple setup file or load a business-critical application, can hamper productivity.
NCSAM 2019: Cybersecurity Tips for Enterprise IT Pros
October is National Cybersecurity Awareness Month (NCSAM) in the US. IT departments are tasked with protecting more than ever. Today’s IT department is responsible for creating, maintaining and managing a myriad of systems. Not only do you need to secure internal connections, but you also need to ensure availability for cloud-based applications and your company website. Many of the suggestions below may be already in place.
Automating Container Infrastructure Management with Spotinst & Rancher
Over the last few years, we have seen a significant shift with companies moving away from developing heavy, monolithic applications and instead adopting new approaches like microservices and even serverless applications. These allow companies to work in a faster and more agile way. Speed and agility are important when a task like deploying a new piece of code to production multiple times a day is normal behavior for a modern environment.
Introducing CloudWisdom, A SaaS Platform that Reduces the Cost and Risk of Operating Public Cloud Infrastructure
We are excited to announce CloudWisdom, a SaaS platform that reduces the cost and risk of operating public cloud infrastructure for enterprise businesses. CloudWisdom optimizes public cloud computing and capacity by recommending configurations unique to your application workloads using machine learning algorithms. This enables our customers to avoid performance bottlenecks and financial waste commonly associated with environments hosted in the public cloud.
Virtual Instruments is now Virtana!
I’m excited to announce that today we’re changing our company name to Virtana. Over the past three years, we have been steadily reinventing Virtual Instruments. You will still find the same deep infrastructure expertise, the same commitment to mission critical workloads, but now our portfolio offers a lot more breadth across the data center and into the public cloud.


