Operations | Monitoring | ITSM | DevOps | Cloud

Latest Posts

10 Reasons You Should Run Your Serverless Applications & FaaS on Kubernetes

Over the last year, along with Kubernetes, Serverless computing platforms have acquired tremendous mindshare among the development community. As Serverless implementations begin to proliferate, I want to make the case that there are tremendous synergies to be gained by bringing both these paradigms together. Some of these benefits have been covered in previous posts. The majority of enterprises are embarking on their DevOps journey. Scaling such processes across a large enterprise is complicated.

Serverless app to speed up all your Lambda functions

A while back, I wrote about how you can shave latency off every AWS SDK operation by enabling HTTP keep-alive, like this. It had the desired effect and I saw lots of people apply this technique in their projects. But it also resulted in the same 10 lines of code being copied and pasted everywhere! I began thinking about ways to distribute an optimized version of AWS SDK so everyone can benefit.

June 2019 Release Overview: Work In Real Time, All The Time, Wherever You Are

This month, we are excited to announce a new set of product capabilities and enhancements designed to ensure that teams can work in real time, all the time, wherever they are. Whether they’re on-the-go with their mobile devices or at their desks on a typical work day, we will continue to innovate without sacrificing ease-of-use and adoption.

How to Decode Your AWS Bill (and What's within DevOps' Control)

The typical AWS bill, otherwise known as the AWS Cost and Usage Report, includes line items that are useful to both finance and DevOps. However, many of the metrics that are within engineers’ and cloud architects’ control aren’t so simple to discover. To make cost a first-class operational metric for DevOps, teams need visibility into the data that’s relevant to engineering activity.

Investigating Timeouts with Tracing

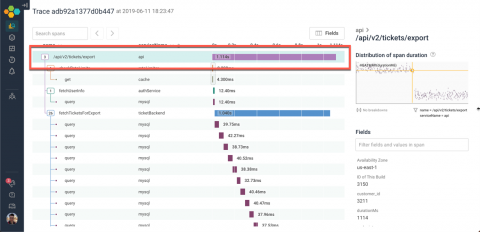
Tracing is one of the key tools that Honeycomb offers to make sense of data. Over the last few weeks, we’ve made a number of improvements to our tracing interface — and, put together, those changes let you think about traces in a whole new way! Tracing makes it easier to understand control flow within a distributed system. We render traces with waterfall diagrams, which capture the execution history of individual requests.

Cassandra vs. MongoDB vs. Hbase: A Comparison of NoSQL Databases

Unlike traditional SQL databases, NoSQL databases, or “non-SQL” databases, do not store their data in tabular relations. Originally designed for modern web-scale databases, they have found widespread use in present-day big data and real-time web applications. Some of the most commonly used data structures include key-value, wide column, graph, and document stores.

How Grafana Labs is Democratizing Metrics Now

Metrics for all – and all for metrics. At Grafana, we not only strive to give people a “single pane of glass” to unify observability metrics. From the very start, our mission has been to advocate for the democratization of metrics, which is the idea that the paradigm needs to shift between who can store data, why they need to store it, and, ultimately, what they’re able to with it. And Grafana users are a great example of how vast and varied the needs are for data access.

Icinga Reporting - Hands On

After our initial release of Icinga Reporting for early adopters we continued our development and are happy to release v0.9.1 today. The release includes bug fixes and some minor enhancements for the usability. I want to take this opportunity to write a post aimed at the people who are new to the whole reporting shabang – like me. This week I set out to figuring out for myself why one would need to use reporting and how to get there – and to share my new knowledge with you!

Updating Your LogDNA AWS CloudWatch Integration

AWS CloudWatch Logs gives you full visibility into your AWS infrastructure, from individual workloads to the services that bind them. Monitoring these logs helps ensure their smooth and continued operation, ongoing stability, and performance. Integrating CloudWatch Logs with LogDNA makes it easier to parse, search, and analyze AWS logs in order to detect anomalies and troubleshoot problems faster.