Operations | Monitoring | ITSM | DevOps | Cloud

Latest Posts

Grafana Plugin Tutorial: Polystat Panel (Part 1)

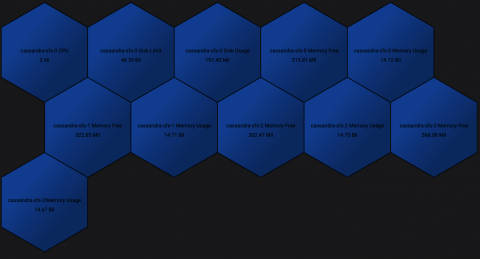
The grafana-polystat-panel plugin was created to provide a way to roll up multiple metrics and implement flexible drilldowns to other dashboards. This example will focus on creating a panel for Cassandra using real data from Prometheus collected from our Kubernetes clusters. We’ll focus on the basic metrics for CPU/Memory/Disk coming from cAdvisor, but a well-instrumented service will have many metrics that indicate overall health, such as requests per second, error rates, and more.

Installing the EFK Stack with Kubernetes with GKE

The ELK Stack (Elasticsearch, Logstash and Kibana) is the weapon of choice for many Kubernetes users looking for an easy and effective way to gain insight into their clusters, pods and containers. The “L” in “ELK” has gradually changed to an “F” reflecting the preference to use Fluentd instead of Logstash and making the “EFK Stack” a more accurate acronym for what has become the de-facto standard for Kubernetes-native logging.

How to Troubleshoot Java Application Slowness Using Java Transaction Tracing

The performance of any application is measured by its availability and responsiveness. When an application is slow, IT operations staff must troubleshoot the cause of slowness, identify it and resolve it. While application performance problems may be caused by issues in the supporting infrastructure, often the issues are related to the application components themselves.

Spring 2019 Release Overview: The Intelligent Enterprise

In today’s always-on digital world, business stakeholders and technical responders across the enterprise must understand the health of their digital services at all times so they can take action immediately when disruptions happen. Yet with operational complexity increasing by 3x per responder on average over the past three years, it’s becoming increasingly difficult for teams to make sense of data and surface meaningful insights to improve digital operations.

The Sales Slip-Ups That Are Holding Your MSP Back

Recurring revenue is the Holy Grail for managed service providers. Unfortunately, it’s an area of the business that most MSPs struggle with. They can’t sell enough new clients, don’t attract the right types of clients, or can’t command the right price. I’ve devoted the last 20 years of my life to understanding, mastering, and teaching others the keys to growing recurring revenue and increasing profitability. Here’s where I see most MSPs falling off the rails.

Logging Your Cloud Foundry Apps to LogDNA

Cloud Foundry Application Runtime is an open source platform as a service (PaaS) for running applications and services. Frequently called simply “Cloud Foundry,” the Cloud Foundry Application Runtime (CFAR) is one of many interoperable projects within the Cloud Foundry family. For the purposes of this post, “Cloud Foundry” refers to the Application Runtime.

How to monitor 1,000 network devices using Sensu Go and Ansible (in under 10 minutes)

Network monitoring at scale is an age-old problem in IT. In this post, I’ll discuss a brief history of network monitoring tools — including the pain points of legacy technology when it came to monitoring thousands of devices — and share my modern-day solution using Sensu Go and Ansible.

Simplifying Cloud Management With OpsRamp: Part 3

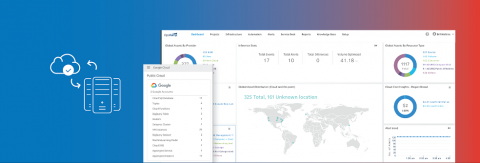
This is the third of a three-part series on how OpsRamp helps enterprise IT operations team manage the challenges of migrating to the cloud. Read part one here and part two here. Now that migration is complete, IT organizations will be responsible for monitoring and managing a mix of hybrid, multi-cloud resources across a distributed footprint. OpsRamp ensures comprehensive visibility, rapid remediation, and constant optimization for these dynamic, multi-cloud environments at scale.