Operations | Monitoring | ITSM | DevOps | Cloud

Latest Posts

Chef vs. Puppet vs. Ansible: Comparing Configuration Management Tools

Configuration management is an essential process for DevOps teams. It allows engineers to manage dozens, hundreds, or even thousands of machines in a consistent and automated way. While there are many configuration management tools available, three of the most popular are Chef, Puppet, and Ansible. In this post, we’ll explain how these tools work and the unique benefits that they offer.

How I Got Comfortable Building with Serverless

A few months back, I blogged about my experience arriving at Stackery after code school. Months later, each day is still interesting and challenging and I’m so glad to have decided to pursue serverless as my concentration. I credit my AWS certifications for narrowing my focus enough to lead me to this point. The serverless community puts so much emphasis on exploration and getting started on your work or experiments today that, getting some exposure to AWS, you can get started right away.

Debug Tough Front-end Errors by Giving Sentry More Clues

Out of the box, Sentry notifies you about crashes in your JavaScript apps and gives you useful tools to help you debug what your app was doing when it broke. If Sentry stopped there, it would still be great and valuable, but it’s possible to maximize your front-end debugging potential with just a few manual optimizations.

Reduce noise in error monitoring with Grouping Suggestions

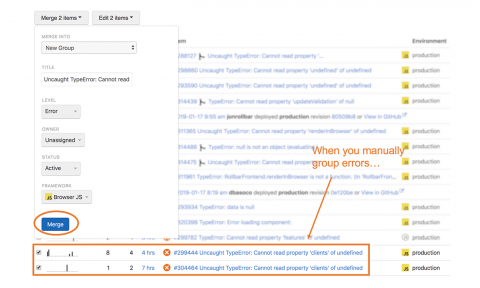
One perennial problem we face in monitoring is dealing with noise. We don't want to miss important signals, but sorting through all the noise can be a chore. Ideally, we want to spend as little time as possible doing the setup work needed to achieve excellent signal-to-noise ratio. The feature we've just released will help you get closer to that optimal setup faster, with less work.

SOLID design principles: Building stable and flexible systems

To build stable and flexible software, we need to keep software design principles in mind. Having error-free code is essential. However, well-designed software architecture is just as important. SOLID is one of the most well-known sets of software design principles. It can help you avoid common pitfalls and think about your apps’ architecture from a higher level.

From black box magic to automation transparency

The CFEngine policy analyzer is an awesome new service introduced in CFEngine 3.13. The policy analyzer allows you to quickly debug policies and inspect what is going on under hood of CFEngine. A known challenge with CFEngine, and most DSL based automation tools, relates to understanding what is actually going on during live operations. Many users view it as “black-box magic”. Unfortunately, the amount of magic and the size of the black box increases with the level of automation.

Monitoring Unicast Flooding Traffic

Unicast Flooding Traffic is associated with the learning process of network switches. In fact, with this method, switches identify the MAC addresses of the devices that are accessible by each of their ports, thus constructing a table that will then be used to decide the destination of each frame that arrives at the switch.

The True Cost of "Search-First" Problem-solving on Your Production Systems

The search-first problem-solving approach—meaning “open up the log search tool” (Splunk, ELK, Loggly, SumoLogic, Scalyr, etc)—is a costly and time-consuming operation during which the true source of a problem is rarely pinpointed in short order. Log search tools require work by the user to transform text strings into fields that are ready for statistical analysis.

Web performance monitoring load-time variations: Causes & fix

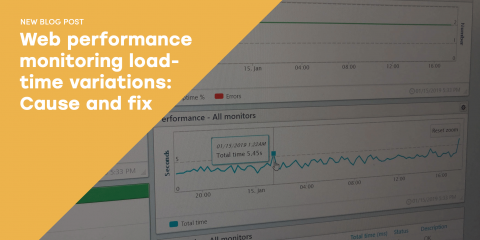
When looking at the performance of your website, web service,or API over a span of time, you will notice variations in the performance reported by the monitor. You may also notice inconsistencies between the performance reported from different monitors. Why? Why do you see spikes in your charts?