Operations | Monitoring | ITSM | DevOps | Cloud

Latest Posts

AWS Elastic Beanstalk: Health and Metric Monitoring

Amazon Elastic Beanstalk allows you to quickly provision the infrastructure needed for an entire application without the hassle of managing the configuration of EC2 instances, Elastic Load Balancers, Auto Scaling, and many other AWS services. Elastic Beanstalk also automatically monitors these resources and provides a simplified view into your application’s health.

How Py Surfaces Critical Errors with Sentry

In A Comedy of Errors, we talk to engineers about the weirdest, worst, and most interesting application and infrastructure issues they’ve encountered (and resolved) over the years. This week, we hear about Py from Derek Lo, Founder and CEO, and Brian Sweatt, Lead Full-Stack Engineer. Py empowers hiring teams with a suite of products to evaluate technical candidates.

Why Kubelet TLS Bootstrap in Kubernetes 1.12 is a Very Big Deal

Kubelet TLS Bootstrap, an exciting and highly-anticipated feature in Kubernetes 1.12, is graduating to general availability. As you know, the Kubernetes orchestration system provides such key benefits as service discovery, load balancing, rolling restarts, and the ability to maintain container counts by replacing failed containers. And by using Kubernetes-compliant extensions, you can seamlessly enhance system functionality.

Speeding Things Up So Your Queries Can Bee Faster

Honeycomb strives to be a fast, efficient tool; our storage back-end satisfies the median customer query in 250ms (and the P90 in 1.3 seconds). Still, every system has its limits, and customers with large datasets know that querying over a long time range, grouping by high-cardinality columns, building complex derived columns, and throwing a quantile or heat map into the mix can lead to some pretty slow queries. If this sounds familiar: good news!

OpManager doubles the number of device templates, cuts your work in half

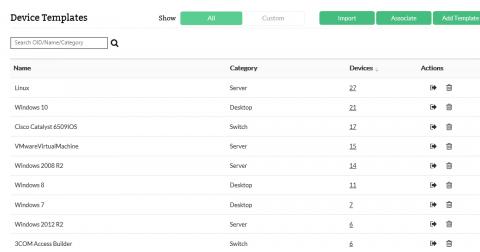
Just last month we heard flattering statements about OpManager’s UX, and nothing makes us happier than knowing that our continuous improvements have positively impacted our users. We’re always eager to meet your growing IT infrastructure needs, so we’re happy to introduce a set of 4,000 new device templates. That doubles the number of OpManager device templates to over 8,000, helping you in your goal of comprehensive network management.

Network Traffic Capture with Network TAPs

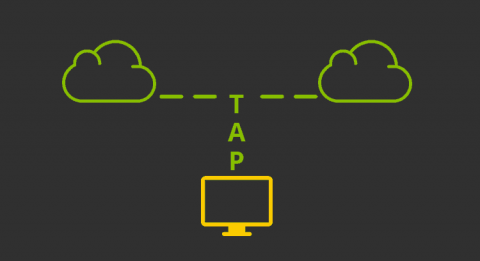
Network TAP (Terminal Access Point or Test Access Point) is the most common hardware device used for network traffic capture purpose. A Network TAP is basically a hardware designed to access the traffic between two network nodes and mirror it into a monitor port where we can connect a third party Analysis tool to listen.