Operations | Monitoring | ITSM | DevOps | Cloud

Latest News

Introducing the Elastic distribution of the OpenTelemetry Java Agent

As Elastic continues its commitment to OpenTelemetry (OTel), we are excited to announce the Elastic distribution of the OTel Java Agent. In this blog post, we will explore the rationale behind our unique distribution, detailing the powerful additional features it brings to the table. We will provide an overview of how these enhancements can be utilized with our distribution, the standard OTel SDK, or the vanilla OTel Java agent.

Navigating the Maze of Incumbent Pricing Models in IT and Security

This is the second in a series of blog posts about the disconnect between modern IT and security teams and the vendors they’re forced to work with. If you’re looking for the first and last posts, you can find it here. In the dynamic world of managing observability and telemetry data, pricing models for tools and platforms are showing their age, creating a significant disconnect between vendors and the IT and security teams they serve.

Deploy The ELK Stack on Kubernetes with Helm

The main objective of the ELK (Elasticsearch, Logstash, and Kibana) is to aggregate logs. However, with the increased usage of ELK and Kubernetes as a pairing the solution can go beyond the aggregation of standard logs and include monitoring and analysis of Kubernetes telemetry data. Therefore, more users are looking at deploying the ELK stack on Kubernetes. Yet, deploying the ELK stack on Kubernetes can be a complex task but with the assistance of Helm charts, the process is much simpler.

Multi-Project Routing For Google Cloud

When sending data to Google Cloud, like logs, metrics, or traces, it can be beneficial to split the data up across multiple projects. This division may be necessary since each team has its own project, a central project is used for security audit logs, or for any other reason that your organization has. BindPlane has effective tools to manage this process. In this walkthrough, we will add fields to telemetry entries, allowing us to associate entries with a specific project and properly route them.

How to Create an S3 Bucket with AWS CLI

Managing an Elasticsearch cluster can be complex, costly, and time-consuming - especially for large organizations that need to index and analyze log data at scale. In this short guide, we’ll walk you through the process of creating an Amazon S3 bucket, configuring an IAM role that can write into that bucket, and attaching that IAM role to your Amazon S3 instance - all using the AWS Command Line Interface (CLI).

Mastering Data Distribution with OpenSearch Shards and Replicas

OpenSearch is an open-source distributed search and analytics engine created for scalability, performance, and ease of use. It is built on Apache Lucene and is a fork of Elasticsearch, designed in response to concerns about Elastic's decision to move away from open-source licensing for certain features in Elasticsearch and Kibana.

Kubernetes Logging | Set Up K8s Log Monitoring with OpenTelemetry

Kubernetes is a powerful orchestration tool for managing containers, but it comes with its own set of challenges. One of the biggest hurdles is effectively logging what's happening in your system. As your applications grow and spread across clusters, keeping track of their behavior becomes crucial. In this article, we will discuss logging in Kubernetes, common Kubernetes log types, and how logs can be effectively tracked and managed.

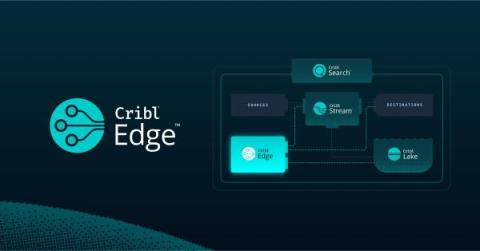
The Journey to 100x-ing Control Plane Scale for Cribl Edge

At Cribl, we value the simplest and quickest path to shipping new things. This is especially true with shipping new products. We took this approach with Cribl Edge, so we could get it into the hands of existing and potential customers as soon as possible to learn more about their needs and requirements. In order to ship a high-quality Edge product quickly, we based all of the systems for management and data streaming directly on the existing, battle-tested systems we built for Stream.

Elastic's RAG-based AI Assistant: Analyze application issues with LLMs and private GitHub issues

As an SRE, analyzing applications is more complex than ever. Not only do you have to ensure the application is running optimally to ensure great customer experiences, but you must also understand the inner workings in some cases to help troubleshoot. Analyzing issues in a production-based service is a team sport. It takes the SRE, DevOps, development, and support to get to the root cause and potentially remediate. If it's impacting, then it's even worse because there is a race against time.