Operations | Monitoring | ITSM | DevOps | Cloud

Latest News

What is the difference between Database, Data Warehouse, and Data Lake?

Data is everywhere in the form of values, text, numbers, pictures and so on that can be stored and used anytime when required. The importance of data and data storage systems has gained recognition since businesses find the potential of big data and its use cases. The data was with us always, but the possibilities to use it effectively were an arduous task.

DevOps As a Bludgeon

When I first started trying to figure out how to automate database deployments, over 15 years ago, I will freely admit, I was both skeptical and reluctant. I had to be dragged up to the notion that automating getting the database code out the door wasn’t just an excuse by the developers to find a way to bypass the DBA team. As per the traditional, biased, story, our favorite word was “No!”.

Effective Technical Writing Is Essential for Your Organization's Success

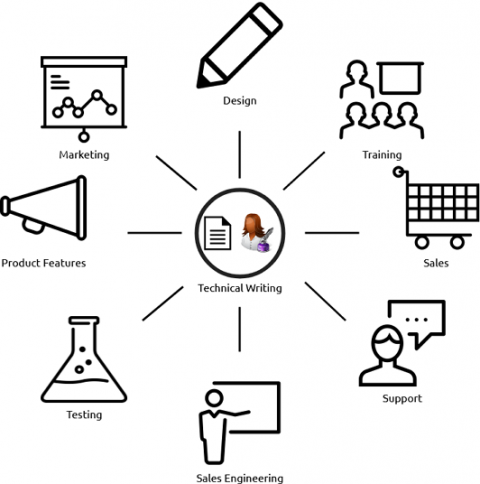
"No one likes documentation", chirped the little blue birds. The bird quotes in the image above are all taken from real tweets and are listed below for accessibility: I can't argue with "liking to write documentation" being a rare skill, since so many people are vocal about disliking it. That tweet might prove to be true, in which case, technical writers should simply be more appreciated for the rare gems that they are. In this blog post, however, I’m going to explain.

Manually Add a Metadata Source in SentryOne Document

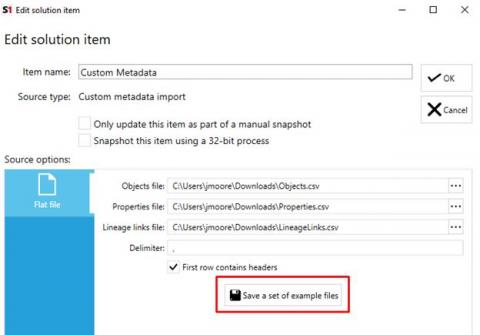
SentryOne Document supports multiple metadata sources, and we plan to expand available providers in the future. But what if you want to add a metadata source that isn’t currently supported? This is where SentryOne Document’s Custom Metadata Import, available in both the Software and Cloud edition, can help. Leveraging this provider, you can manually insert any metadata source—DB2, REST API, or others.

Three Steps To Get Started With Database DevOps

Once you’ve committed to changing your culture in order to automate your database deployments, what’s next? You’ve already done the hard part, making the decision to shift the culture. Now, what’s involved is just lots of labor. There are three things you can do to begin your Database DevOps journey: Let’s discus these in detail. It’s important to understand, not just why these are your first three steps, but why they should occur in this precise order.

Application-Centric and Database-Centric Monitoring: Why You Need Both

How would you like it if your application shut down or started running slow without any warning? Let’s say, for instance, users who like your application try to access it, but aren’t able to. How would you know whether low traffic to your site is because users weren’t satisfied or because they simply weren’t able to access it? Users definitely won’t be satisfied when your application starts crawling with long response times.

What if You Could Autonomously Monitor Across Your Databases?

When DevOps teams talk about monitoring a database, the primary motivation is to ensure that the database won’t suffer a performance hiccup. Long queries, timeouts and table scans are among the most popular causes behind lousy customer experience. However, in recent years, more data has been shifted to cloud databases.

Monitor VoltDB with Datadog

VoltDB is an ACID-compliant, in-memory relational database designed to support real-time analytics. VoltDB’s in-memory storage, stored procedures, and shared-nothing architecture make it specifically optimized for quickly processing massive streams of data. This means VoltDB is tailored for use cases like online gaming, telecommunication, and financial applications, which require fast data processing.

How to monitor your key process with Bleemeo?

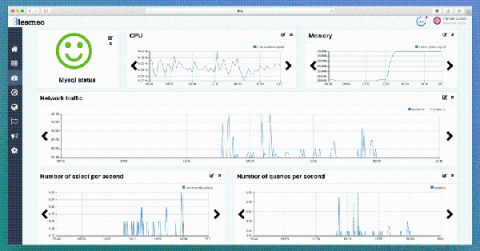
This article explains how to monitor service process on your service with Bleemeo using MySQL as an example. This feature is what we called "Key Process Monitoring" and is described by our documentation. Currently, you can monitor any service process automatically discovered by Bleemeo. All metrics are detailed in our documentation, in a few words, metrics related to memory, cpu, network and i/o used by this process are gathered by the agent.