Operations | Monitoring | ITSM | DevOps | Cloud

Latest News

Elastic's RAG-based AI Assistant: Analyze application issues with LLMs and private GitHub issues

As an SRE, analyzing applications is more complex than ever. Not only do you have to ensure the application is running optimally to ensure great customer experiences, but you must also understand the inner workings in some cases to help troubleshoot. Analyzing issues in a production-based service is a team sport. It takes the SRE, DevOps, development, and support to get to the root cause and potentially remediate. If it's impacting, then it's even worse because there is a race against time.

Sentry on Sentry: How Metrics saved us $160K

If you know me, you know I care about fast code. Recently, I ran a simple query that revealed that we spend almost $160k a year on one task. Luckily, we launched the Metrics beta back in March. Over the last month or so, 10 of us Sentry engineers collaborated across many functions to leverage Metrics to track custom data points and pinpoint the issue leading to this ridiculous ingestion cost.

Cisco AppDynamics modernizes self-hosted observability for hybrid application monitoring

We’re excited to announce multiple innovations available now in Cisco AppDynamics On-Premises, including AI-powered detection and remediation, application security with Cisco Secure Application, application and business performance monitoring for SAP® Solutions, and more.

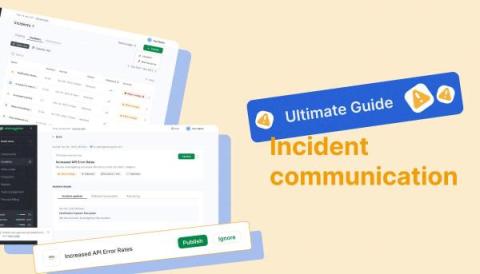
The Ultimate Guide To Incident Communication in 2024

In the digital realm, incidents such as service disruptions and security breaches are inevitable. Incidents affect your customers and stakeholders. Also, incidents pose significant challenges to IT, Ops, DevOps, and customer support teams. As we increasingly depend on digital tools and services, the demand for seamless performance escalates, highlighting the importance of effective incident communication.

Observability, Telemetry, and Monitoring: Learn About the Differences

Over the past five years, software and systems have become increasingly complex and challenging for teams to understand. A challenging macroeconomic environment, the rise of generative AI, and further advancements in cloud computing compound the problems faced by many organizations. Simply understanding what’s broken is difficult enough, but trying to do so while balancing the need to constantly innovate and ship makes the problem worse.

Progress WhatsUp Gold a Leader in G2 Network Monitoring Tools Report - Again! Named One of the Best IT Infrastructure Tools for 2024

G2 software reviews are not your traditional take on a product, where they put it in a lab or, more likely, someone’s home office and see how it goes. No, G2 reviews are driven by actual users who have put the tool through its paces and generally rely on it every day. That’s why being chosen as a leader in the G2 Grid® Report for Network Monitoring Tools report is such an honor – because G2 didn’t choose WhatsUp Gold, you did!

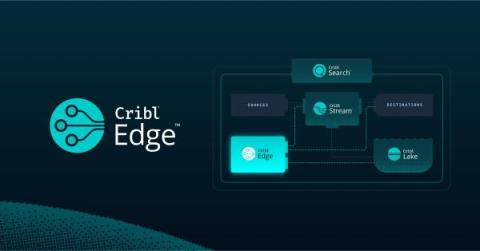
The Journey to 100x-ing Control Plane Scale for Cribl Edge

At Cribl, we value the simplest and quickest path to shipping new things. This is especially true with shipping new products. We took this approach with Cribl Edge, so we could get it into the hands of existing and potential customers as soon as possible to learn more about their needs and requirements. In order to ship a high-quality Edge product quickly, we based all of the systems for management and data streaming directly on the existing, battle-tested systems we built for Stream.

Kubernetes Logging | Set Up K8s Log Monitoring with OpenTelemetry

Kubernetes is a powerful orchestration tool for managing containers, but it comes with its own set of challenges. One of the biggest hurdles is effectively logging what's happening in your system. As your applications grow and spread across clusters, keeping track of their behavior becomes crucial. In this article, we will discuss logging in Kubernetes, common Kubernetes log types, and how logs can be effectively tracked and managed.

Using Kubectl Logs | Complete Guide to viewing Kubernetes Pod Logs

Information about the containers and pods on your cluster may be obtained using the kubectl logs command. These logs allow you to know the performance of your applications, whether they are failing or healthy, and are particularly useful for debugging and troubleshooting purposes. In this article, we will see how to use the kubectl logs command to get information from existing resources in a Kubernetes cluster. Before we dive in, let's first take a quick look Kubernetes architecture and logging.