Operations | Monitoring | ITSM | DevOps | Cloud

Latest News

New integration offers a consolidated look at your APM alerts

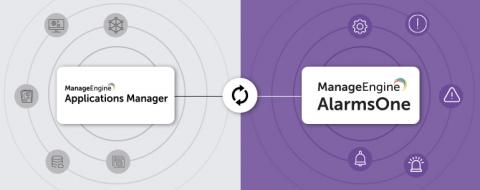
Application monitoring and alerting go hand-in-hand. Alerts point out critical issues in your infrastructure and help you identify and remediate components causing service degradation and disruption. To reduce the complexity involved in managing IT alerts, we’ve developed an integration between our application monitoring tool, Applications Manager, and our alert management solution, AlarmsOne.

Sponsored Post

EventSentry v4.0 - Introducing ADMonitor

Since Active Directory is the foundation of all Windows networks, monitoring Active Directory needs to be part of any comprehensive security strategy. Up to version 3.5, EventSentry utilized Windows auditing and the security event log to provide reports on: User Account Changes, Group Changes and Computer Account Changes.

Sponsored Post

A New Approach to Traffic Balancing: PerfOps Announces Smart Internet Routing

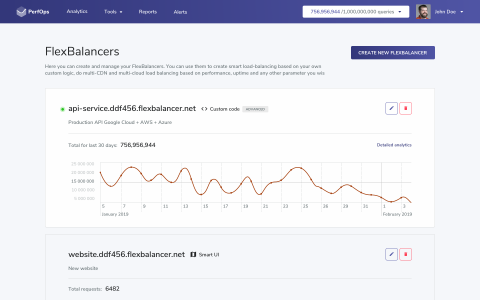
Network traffic expert PerfOps just announced FlexBalancer, an innovative approach to load balancing. FlexBalancer is a cloud-based solution that dynamically routes traffic in real time. It does so by leveraging CDN and Cloud performance data and combines it with user-defined parameters.

Providing Visibility and Security for AWS App Mesh

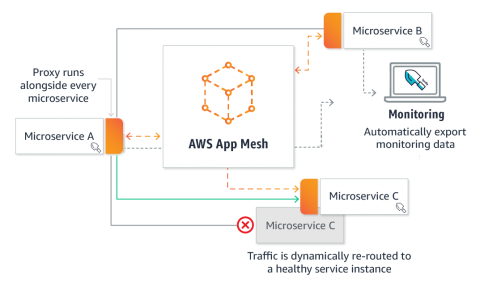
Microservice architectures running on containers have made applications easier to scale and faster to develop. As a result, enterprises are able to innovate faster and accelerate time-to-market for new features. To make management of microservices even more efficient and easier to run, service mesh solutions like Istio, Envoy, and Linkerd – and now AWS App Mesh – have become the next core building blocks of microservices infrastructure built on containers.

Monitoring Kubernetes Clusters on GKE (Google Container Engine)

The Kubernetes ecosystem contains a number of logging and monitoring solutions. These tools address monitoring and logging at different layers in the Kubernetes Engine stack. This document describes some of these tools, what layer of the stack they address, as well as best practices for implementation including an example from the field, a quick start, and a demo project.

Downsampling and Exporting Stackdriver Monitoring Data

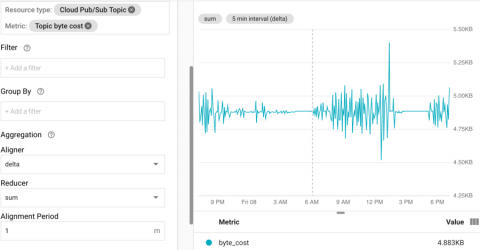
Stackdriver Monitoring contains a wealth of information about cloud resource usage, both for Google Cloud Platform (GCP) and and other sources. This post will explain how to use the Stackdriver Monitoring API to read, downsample, and export data from Stackdriver to BigQuery. Pub/Sub metrics will be used to demonstrate this.

Why Your Website Needs Uptime Monitoring in 2019

When a visitor types your website into the search bar, they intend to see your website and not a broken link/webpage. In a digital world where we want everything right now, a website that is not available right now is a website we probably will not go back to in the future. That much should be obvious to everyone. If you are not careful, your website could be sending your visitors to your competitors. So how do you keep track of your website 24/7? One answer is to use an uptime monitoring service.