Operations | Monitoring | ITSM | DevOps | Cloud

Latest News

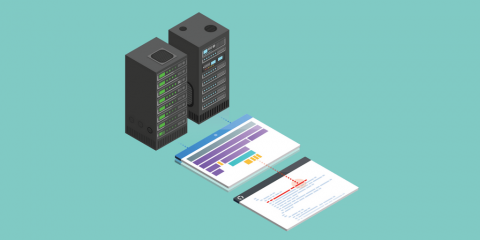
Server monitoring best practices: 9 dos and don'ts

Have you ever had responsibility for an application and been the last to know about an outage? I have, and it’s terrible. You go to check your phone in the morning over coffee, after waking up, and you see a flood of missed calls and tons of emails. Customers are angry. Your boss is demanding to know what’s happening. Even the company’s executives are involved. How did this happen?

Tackling the top four challenges of Azure SQL Database monitoring

With large enterprises increasing their focus on public cloud providers, Microsoft Azure continues to have a strong foothold in the hybrid cloud industry. Azure adoption increased a whopping 11 percent last year from 34 to 45 percent, reveals the latest survey by RightScale.

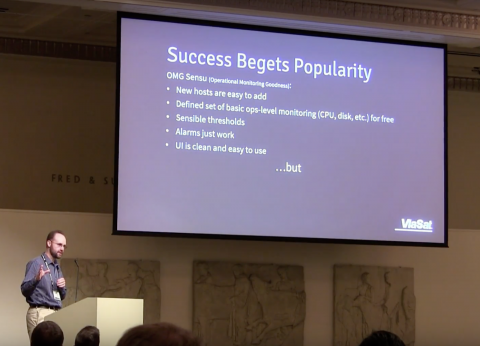
Migrating to Sensu, as told by a Nagios refugee

One of our favorite stories at Sensu is hearing how our customers are using, repurposing, and even replacing their Nagios setup. The Sensu monitoring event pipeline lets you run your existing Nagios plugins while also preparing you for what’s next; while Nagios has been tried and true for many, Sensu empowers businesses to modernize their infrastructure with a comprehensive, future-proof monitoring solution.

MSPs Face Highly Fragmented Network Hardware Market

WATERLOO, ON / August 28, 2018 — The network hardware market is highly fragmented, with hundreds of equipment vendors vying for market share, says a new report from Auvik Networks. There’s intense competition in the network switch, router, firewall, and access point hardware markets, with upwards of 40 vendors competing in each category.

Managing Network Vendor Diversity: The MSP Challenge

Whether you inherit an IT environment or build it from scratch, managing your clients’ network infrastructure can be a real headache. Keeping clients’ network devices functioning so they stay connected and productive requires complex manual tasks, expensive expertise, and tons of valuable time—that is, if you don’t use software to simplify and automate network management activities.

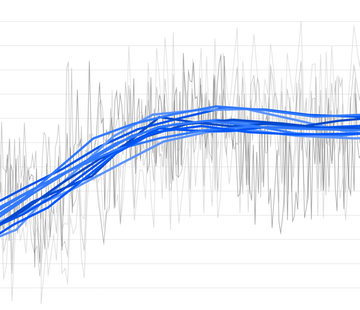
Auto-smooth noisy metrics to reveal trends

Datadog makes it easy to correlate, compare, and visualize metrics from your infrastructure and applications. Some metrics, however, are inherently so noisy that the graphs become unreadable (the dreaded spaghettification problem), and you lose the ability to extract essential information about trends and large-scale deviations. For cases like these, we provide several smoothing functions that help you identify trends in your metrics.

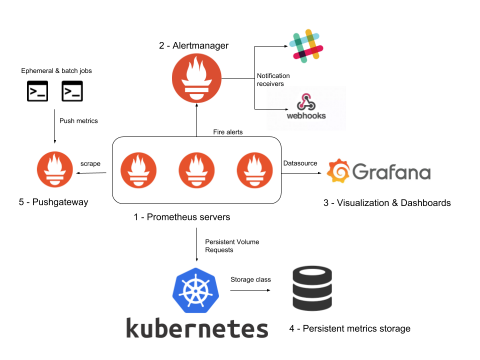
Kubernetes Monitoring with Prometheus: AlertManager, Grafana, PushGateway (part 2).

A complete ‘Kubernertes monitoring with Prometheus’ stack is comprised of much more than Prometheus servers that collect metrics by scraping endpoints. To deploy a real Kubernetes and microservices monitoring solution, you need many other supporting components including rules and alerts (AlertManager), a graphics visualization layer (Grafana), long term metrics storage, as well as extra metrics adapters for the software that is not compatible out of the box.