Operations | Monitoring | ITSM | DevOps | Cloud

Latest News

SPA Tracking & Monitoring: How to Build Better Single-Page Applications Through RUM (Real User Monitoring)

Did you know roughly half of the users that visit your website leave if it takes more than 3 seconds to load? Optimizing your website or webapp for stellar performance is always a crucial goal for any software based business. But, the ecosystem has changed in recent years. Smartphones are taking over. Developers need to build websites and optimize for performance primarily targeting these smaller devices. It’s not solely about performance though.

Best Practices for Managing Elasticsearch Indices

Elasticsearch is a powerful distributed search engine that has, over the years, grown into a more general-purpose NoSQL storage and analytics tool. The recent release of Elasticsearch 7 added many improvements to the way Elasticsearch works. It also formalized support for various applications including machine learning, security information and event management (SIEM), and maps, among others, through a revamped Kibana.

How to build a CICD pipeline for Serverless apps with TravisCI

Seed is a fully managed CI/CD pipeline for Serverless Framework applications. In one of our previous posts we looked at how to build a CI/CD pipeline for Serverless apps on AWS with CircleCI. Today, we’ll look at how to do the same with Travis CI. The purpose of these posts is to dive deep into real-world CI/CD setups, something which most of the tutorials out there skip. We’ll try to illustrate how to set up something similar to Seed but using Travis CI instead.

PagerDuty: Empowering People in Moments of Truth

Our founders created PagerDuty with the simple goal of making the lives of on-call developers better—and in doing that, we’ve championed a new way of working, inspired by the DevOps mindset. From that starting point, we’ve evolved our on-call product into a platform for real-time operations that enables our customers to grow from on-call rotations, to incident management and response, to full digital operations management.

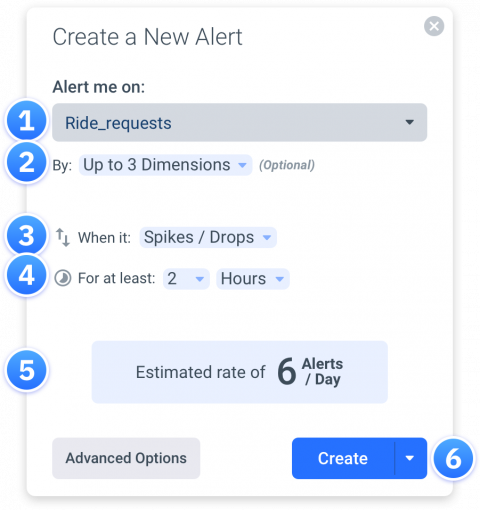
Creating an Alert in Anodot is Now Easier Than Ever

When you first set up your Anodot account, you create alerts on the KPIs that matter most to you. Advanced alert configurations enable you to define various parameters so that you only get alerts that are important to you: selecting the metric, building a query, grouping the data by dimensions, selecting triggers and conditions, choosing who and where it should be sent to, and so on.

Atlassian: Anodot is our 'Safety Net'

With AI analytics slated as the biggest disruptor to big data and analytics, data leaders are quickly integrating this capability into their data strategy. Itzik Feldman, data engineering manager at Atlassian, the enterprise software company responsible for Jira and Trello, recently credited Anodot with helping keep the company’s 3,000 employees in touch with product performance and customer experience.

[OpsComm August] Delivering New Innovations with the August 2019 Release and Controlling the Chaos at Gartner Catalyst

The August 2019 release introduced several platform updates for enhanced service-centricity with improved topology maps, machine learning transparency for intelligent event management, real-time visibility for public cloud monitoring, and deeper integrations.

Auvik Use Case: Proactively Monitor and Manage Networks

It’s a story we often hear from our partners: A client calls and their network’s down, so our partner logs into Auvik, pinpoints the problem, and gets them back up in no time. Everyone’s happy. But your client shouldn’t have to make that first call. And if you’re using Auvik to its full potential, they likely won’t have to. Turning Auvik on when a client reports a major problem doesn’t make full use of Auvik’s power. For that, it needs to be on all the time.