Operations | Monitoring | ITSM | DevOps | Cloud
Latest News
Free Email Support For All
Over the last few months we've made several upgrades for Pro users, including: bulk import of monitors and customisable alert times. This time, we have an upgrade for our Free Plan users...
The Connected Home - How Secure Are All These Gadgets?
Connected or smart homes are becoming more commonplace as people use computer networks to control different aspects of their in-house technology. But how secure are these networks?
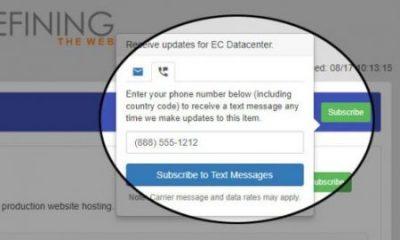
New Feature Spotlight:StatusKeeper welcomes SMS/text notifications to your hosted status page!
Email arrives constantly; when we’re in the office or “on the go”. More than occasionally a new email might be briefly overlooked if we’re working another task or it just gets lost in the “noise”. Whatever the case, they don’t always get the attention that an incoming text message might.
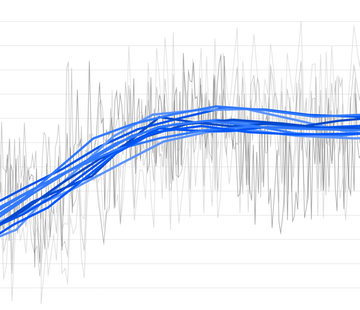
Auto-smooth noisy metrics to reveal trends
Datadog makes it easy to correlate, compare, and visualize metrics from your infrastructure and applications. Some metrics, however, are inherently so noisy that the graphs become unreadable (the dreaded spaghettification problem), and you lose the ability to extract essential information about trends and large-scale deviations. For cases like these, we provide several smoothing functions that help you identify trends in your metrics.
10 Cloud Migration Best Practices
With the increasing benefits of using the cloud, more and more organizations are migrating over their workloads. The key driver for this migration is the adoption of technology across every business vertical. With technology adoption, the investment in resources increases significantly.
Splunk vs SumoLogic vs ELK
From production monitoring to security concerns, it’s critical for businesses to analyze and review their log data. This is particularly true for large and enterprise companies, where the sheer amount of data makes log analysis the most efficient way to track key indicators. CTOs, in particular, are dealing with the challenges of this massive amount of data flowing through their organization, including how to harness it, gather insights from it, and secure it.
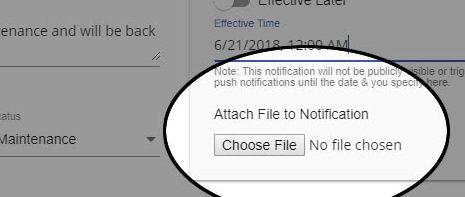
New Feature Spotlight: Notification Attachments
Continuing deeper exploration of some of our exciting new features, today I’ll be presenting Notification Attachments and demonstrating how your status page can, once again, hopefully make your job a little easier. We recently had a customer ask: “Is there a way to show a maintenance page instead of [just] an icon if the web services are down?”. Further investigation revealed he was looking for the ability to provide more information to his users regarding the nature of a system outage.
Location, Location, Location.
StatusGator has a few thousand users. Recently I grew curious as to where you all are. Surely it would be interesting to learn a little about where they are from. The results are pretty interesting. I’m pleased to report StatusGator helps users in 85 different countries!
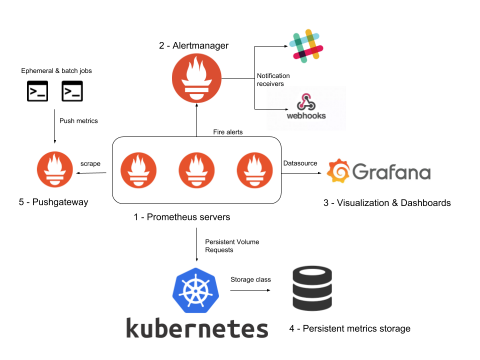
Kubernetes Monitoring with Prometheus: AlertManager, Grafana, PushGateway (part 2).
A complete ‘Kubernertes monitoring with Prometheus’ stack is comprised of much more than Prometheus servers that collect metrics by scraping endpoints. To deploy a real Kubernetes and microservices monitoring solution, you need many other supporting components including rules and alerts (AlertManager), a graphics visualization layer (Grafana), long term metrics storage, as well as extra metrics adapters for the software that is not compatible out of the box.


