Operations | Monitoring | ITSM | DevOps | Cloud

Latest News

Datadog vs Grafana: Comparison Guide 2024

Monitoring tools are essential for maintaining stability and performance. They enable organizations to monitor diverse metrics, analyze trends, and identify anomalies to prevent downtime and maximize resource efficiency. Among the leading solutions in this domain, both Datadog and Grafana are recognized for their effectiveness and versatility. Understanding the nuances between these platforms is vital for businesses to make informed decisions about which tool best suits their needs.

Streamlining SharePoint with Squirrel

In today’s fast-paced digital environment, managing large volumes of documents in SharePoint Online can be a daunting task for any organization. As businesses grow, so does the need for efficient, cost-effective storage solutions that not only save space but also ensure compliance and ease of access. Enter Squirrel, an innovative SaaS product designed to automate the archiving of documents from SharePoint Online to Azure Blob Storage, providing a seamless blend of efficiency and security.

What Causes High Latency in Networks: The Silent Speed Bumps on Your Digital Highway

Have you ever felt like you're stuck in digital rush hour? You click on a link, and the page takes an eternity to load. A video call turns into a frustrating slideshow of frozen frames. These experiences can be incredibly disruptive, and the culprit is often a hidden enemy known as latency. Think of your network as a highway for information. Latency is like a speed bump that disrupts the smooth flow of data.

Serverless Architecture Design Patterns For Cost Efficiency

Serverless architecture has emerged as a pivotal technology for developers seeking to build scalable, efficient applications without the overhead of managing servers. At the heart of this revolution are services like AWS Lambda and API Gateway, which have redefined how we deploy and scale applications, offering a truly pay-as-you-go model that aligns operational costs directly with actual usage.

Server Administrator's Guide to POP3 and IMAP Monitoring

Over 347 billion emails were sent and received every day in 2023, a number that is expected to increase to over 361 billion daily emails in 2024. With so much information always flowing, the reliability and efficiency of email servers have never been more important. So what happens when servers fail and emails don’t go through? Consider the financial repercussions — downtime can cost businesses as much as $5,600 per minute (a whopping $300,000 per hour).

Best Practices for Operating and Monitoring an SD-WAN Network

SD-WAN has emerged as a game-changer for organizations seeking to optimize network performance and enhance connectivity across geographically dispersed locations. However, you need effective operational and monitoring practices to get the full benefit of SD-WAN. This becomes increasingly important due to the operational and security challenges that arise as SaaS applications become more popular and end users can work from anywhere.

Launching Resource Performance Monitoring

What is the slowest part of your website? Most of the time, it’s the resources: all the CSS, fonts, images, and JavaScript that powers your webpage. Resources that are too big or too slow are often the root cause of slow Core Web Vitals. This week, we’re releasing a bunch of new tools and reports to better understand your web resources, how they impact your website performance, and where you have opportunities to improve.

Deploy The ELK Stack on Kubernetes with Helm

The main objective of the ELK (Elasticsearch, Logstash, and Kibana) is to aggregate logs. However, with the increased usage of ELK and Kubernetes as a pairing the solution can go beyond the aggregation of standard logs and include monitoring and analysis of Kubernetes telemetry data. Therefore, more users are looking at deploying the ELK stack on Kubernetes. Yet, deploying the ELK stack on Kubernetes can be a complex task but with the assistance of Helm charts, the process is much simpler.

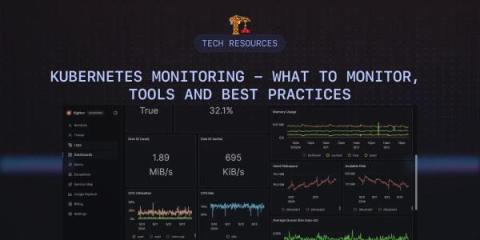
Kubernetes Monitoring - What to Monitor, Tools and Best Practices

Kubernetes has since emerged as “THE” container orchestration platform for deploying and managing containerized workloads as a result of its robust capabilities. However, the complexity of its architecture and its dynamic nature present significant challenges in monitoring deployed workloads and the platform itself. Kubernetes monitoring is crucial for maintaining the health, performance, and reliability of containerized applications.

Centralized Logging with Open Source Tools - OpenTelemetry and SigNoz

Modern-day software systems emit millions of log lines per minute. Cloud computing and containerization have made it easy to have distributed systems. Distributed systems emit logs from multiple sources. While developers have always used logs to debug stand-alone applications, centralized logging solves the challenges of modern-day distributed software systems.