Operations | Monitoring | ITSM | DevOps | Cloud

Latest News

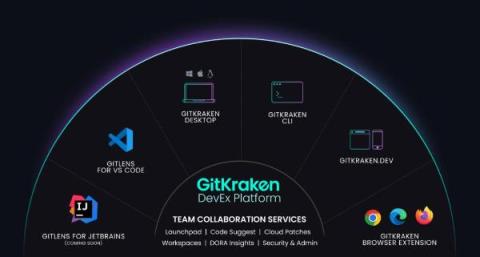
GitKraken Acquires CodeSee & Launches New, Ubiquitous DevEx Platform

TL;DR: GitKraken acquires CodeSee and launches the unified GitKraken DevEx Platform, enhancing workflows across all major development environments and setting new standards in developer tools. Dive in to discover our powerful new features and how they contribute to simplifying your coding life. Almost a decade ago, we introduced GitKraken Client with a clear mission: make Git simpler for developers.

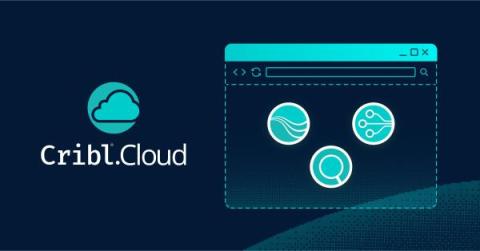
Finding a Better Way to Work in the Cloud!

With the 4.6 release, Cribl.Cloud Enterprise users now have the opportunity to opt-in to a new cloud experience. As a deeply customer-centric company, we listened to your feedback, and we heard you! We are making our user experience efficient, secure, and flexible. As we work to refine this new experience, we invite you to partner with us and share your input to influence this transformation as it makes its way across the entire Cribl suite!

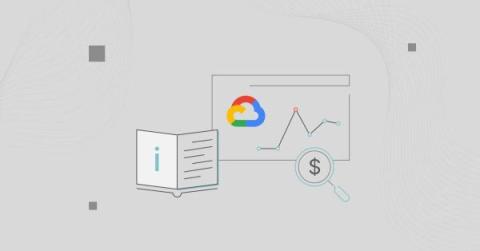
A Guide To GCP Cost Anomaly Detection

Keeping costs under control is crucial to managing projects on the Google Cloud Platform (GCP). Yet, even the most experienced teams can face unexpected increases in their cloud bills. These surprises, known as cost anomalies, can disrupt budgets and plans. But, with the right approach and tools, you can spot these issues early and keep your cloud spending on track.

NetFlow Analyzers: Definitions, Key Features & Use Cases

Imagine your company’s network is like a busy city’s road system. Just like roads have traffic moving back and forth, your network has data packets traveling to and from destinations. But when the roads get too crowded, or a suspicious vehicle makes its way onto the highway, it can cause traffic jams and security incidents that impact the organization. That’s where NetFlow analyzers come in. In this article, we’ll break down the basics of NetFlow analyzers.

Modern Observability 101

In technology, having “modern” capabilities is standard. Staying ahead of the curve is critical, and keeping outdated technology or processes going can be a recipe for disaster in a complex, ever-changing landscape. Ensuring the smooth functioning and performance of software systems is paramount. This is where modern observability—a sophisticated approach to monitoring and understanding the inner workings of applications and infrastructure—is required.

Comprehensive Guide to Server Uptime Monitoring

This guide offers a deep dive into server uptime monitoring, focusing on the strategies and tools essential for seasoned IT professionals to implement. We’ll explore advanced metrics, fine-tune the deployment of tools like Heartbeat, and dissect integration practices with the ELK stack. Designed for technical leaders who manage complex infrastructures, this guide aims to enhance your methodologies in maintaining high availability and optimizing operational performance across your server ecosystems.

OpenTelemetry: The Key To Unified Telemetry Data

OpenTelemetry (OTel) is an open-source framework designed to standardize and automate telemetry data collection, enabling you to collect, process, and distribute telemetry data from your system across vendors. Telemetry data is traditionally in disparate formats, and OTel serves as a universal standard to support data management and portability.

Grafana transformations: 10 new ways to get more out of your data

One of the superpowers of Grafana is the ability to bring all of your data into a single platform thanks to our rich catalog of data sources. Oftentimes you will want to visualize information from disparate data sources together in a single dashboard or panel. Or you might want to refine data returned from queries without altering the original data source. Or you may need to modify data due to limitations of a query language that stops you from getting the required formatting.

Grafana Alerting: new tools to resolve incidents faster and avoid alert fatigue

The maturity of your alerting strategy has a direct impact on the reliability of your infrastructure and your applications. It can also have a big impact on engineering productivity. So whether you’re talking about resolving incidents faster or avoiding alerting fatigue, alerting should always be front and center.

How reliability differs between monolithic and microservice-based architectures

Microservices have forever changed the way we build applications. Tools like Docker and Kubernetes made microservice-based architectures widely accessible to software developers, and cloud platforms like Amazon EKS made deploying containers fast and inexpensive. They've also enabled even small engineering teams to deploy code faster, leverage fault tolerance and redundancy, scale more efficiently, and take full ownership of their services from development all the way into production.