Operations | Monitoring | ITSM | DevOps | Cloud

Latest News

How SkySilk Cloud Services uses Grafana dashboards

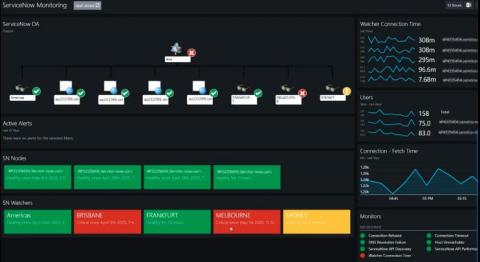
Stefano Mitchell is a customer support engineer at SkySilk Cloud Services. It’s no secret that there is a correlation between a team having quick access to metrics and swift resolutions. Accurate monitoring metrics displayed in a clear and efficient manner help your teams respond to alerts and issues as they arise in real time. SkySilk Cloud Services, a cloud services provider, uses Grafana dashboards internally to maintain a strong overview of regional system health.

Using AI to Auto-Detect and Remediate Incidents

Today, the number of possible failure modes in cloud and microservices applications are exploding, making it increasingly difficult to gain true observability and take the right action across IT environments. According to Lightstep’s Global Microservices Trends report, 91% of teams are using or have plans to use microservices, but 73% report it is harder to troubleshoot application performance problems due to greater complexity.

Continuous Releases with Travis CI and Sentry

Here at Sentry, we use Travis CI, a continuous integration tool for GitHub that lets us automate our tests and view the results right within each pull request. In this blog post, we’ll walk through a quick example of how to automatically create Sentry Releases with Travis CI when a commit is pushed to your project’s master branch. (Sentry Releases enable some of our best features, like identifying the commits that likely introduced new errors, and much more!)

HTML to PDF API

We are releasing our HTML to PDF REST API to public preview: https://html2pdf.appbeat.io/ We are using this tool internally for generation of various PDF documents. It uses Chrome engine for HTML rendering and creates really nice looking documents. It supports synchronous and asynchronous operation where you can be notified about PDF conversion result via webhook.

Taming the CMDB Beast is Finally Within Reach

Managing IT infrastructure today can feel like a game of Tetris. Operations staff are constantly managing the addition of new pieces, trying to quickly determine how to best position them while the clock is ticking before the next round drops. Ultimately, decisions made early on impact what comes later and vice versa.

Why Your Status Page Matters and How to Use It

When an outage hits your service, everybody starts talking. Your engineers are talking about what caused the problem, and how to fix it; your management is asking about when it’ll be fixed; and your customers are telling the world that they’re not happy. But there’s an even more important conversation you should be having: communicating with your users about the issue.

Why a Unified DevOps Platform Matters

In today’s enterprises, DevOps isn’t one process, but many thinly connected tasks. A stack of DevOps tools that need to work together to operate as a single system, each one requiring its own integration and maintenance. The JFrog DevOps Platform unifies our industry-leading products because DevOps has a single goal: to speed releases from code to production. It takes several tools to build DevOps, but DevOps tools need to function as one.

(Fish) Farm-to-Table Produce With PagerDuty

Most of us are familiar with the traditional farms that have existed since humans learned to sow and harvest crops—these farms have provided us with food for centuries. And for a long time, due to the lack of refrigeration and other technology, humans lived near their food sources. But industrialization has also led to centralization of farming systems, with farms getting larger and further from consumers and with distributors depending on preservatives or refrigeration to extend shelf life.

They Aren't Pillars, They're Lenses

To have Observability is to have the ability to understand your system’s internal state based on signals and externally-visible output. Honeycomb’s approach to Observability is to strive toward this: every feature of the product attempts to move closer to a unified vision of figuring out what your system did, and how it got there.

Connecting Ethereum

ETHDenver connects developers, technologists, cypher punks, coders, crypto-economists, designers and makers to build on Ethereum, making it the perfect place to debut Splunk Connect for Ethereum. The use cases we saw added observability to blockchains like Ethereum mainnet and sidechains in real time. As the event went on, use cases and requests continued to pop up (which you'll see below); the app was used to index not just ethereum mainnet, but also sidechains such as xDai and OST Mosaic.