Operations | Monitoring | ITSM | DevOps | Cloud

Latest News

Monitoring Errors in Android Apps

When developing mobile apps it’s important to monitor errors so that you can understand your user’s experience. You need deeper insight than just a crash report because errors could cause a degraded user experience or a drop in key behavioral metrics. Your team needs to know quickly when there are production problems either with the app itself or with your backend services so you can fix the issue before more customers are impacted.

How to not lose your s#!t during an incident

Often I am asked how I always seem calm and poised during incidents. This persona is not entirely accurate as I am more like a duck in these scenarios, calm on top of the water, but paddling frantically under the water. I have learned some tricks that have helped me stay calm and drive incidents to resolution.

OpenTracing: Jaeger as Distributed Tracer

In the previous two parts of OpenTracing series, we provided a good OpenTracing overview, explaining what OpenTracing is and does, how it works and what it aims to achieve and looked at Zipkin – a popular open-source distributed tracer. In this blog post, we will look at Jaeger, a newer open-source distributed tracer developed under the CNCF umbrella.

Announcing Sensu 2.0 Beta

We’re excited to announce that Sensu 2.0 Beta is now publicly available for testing! Sensu 2.0 is easier to install and operate, requiring only a single sensu-backend process and sensu-agent process that communicate directly with each other. Our new API-driven approach gives you more flexibility when integrating Sensu into your existing infrastructure and tools. We believe this newest release is built to scale and meet the needs not only of your infrastructure today, but for years to come.

MTTD vs. MTTF vs. MTBF vs. MTTR

Development and operations (DevOps) teams must measure their day-to-day progress. Otherwise, these teams won’t know how they are performing at a given moment. Worst of all, DevOps teams that lack data-driven insights risk falling behind, missing service-level agreement (SLA) requirements and encountering various service problems that could put a company, its employees and its customers in danger.

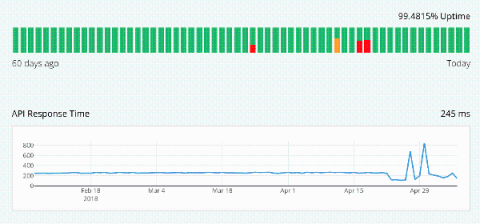
Uptime and Response Time Graphs

As one of the most requested features we are happy to officially introduce the Uptime and Response time graphs. Setting up an uptime graph requires zero configuration, it’ll be added automatically to your status page (for startup & business subscribers) and you can choose to hide it in the design page of your admin panel.

Empowering Help Desk Professionals to Proactively Solve End User Problems

Help desk technicians form the front line of support in identifying, troubleshooting, and preventing end user performance issues (and costly downtime) for key applications and services. They need to quickly identify the scope of the issue and route the critical details required to fix the issue – fast. Goliath Technologies increases the troubleshooting and remediation abilities of help desk technicians by placing a vast array of tools at their fingertips.

We've come a long way together ... Icinga turns 9

Born to be wild. We’ve been busy with bringing Elasticstack integration into full shape with the Icinga 2 feature and the corresponding Icinga Web 2 module. Both of them were thankfully funded and sponsored by VW. Elasticsearch 6 support is sponsored by a customer too, this will hit 2.9 later in June. Earlier in 2017 we’ve also released the Logstash output for Icinga.