Operations | Monitoring | ITSM | DevOps | Cloud

Latest Videos

AVD Performance Dashboard

In this dashboard tutorial video, we will walk you through building an Azure Virtual Desktop dashboard. This dashboard provides users with the visibility they need into the status of Azure Virtual Desktop. The Azure Virtual Desktop dashboard combines CloudReady and Service Watch metrics for a holistic view of Azure Virtual Desktops availability and performance. When issues occur, users can quickly review the dashboard to identify whether the issues is limited to an office, individual device, or affecting Azure Virtual Desktop as a whole.

Network Performance Dashboard

In this dashboard tutorial video, we will walk you through building a Network Performance dashboard. This dashboard provides users with the visibility they need into the status of their network performance from their offices down to an individual users device. Obtaining this single pane of glass visibility is made easy with the combination of both CloudReady and Service Watch metrics into dashboards. When utilizing these dashboards, users can quickly identify which networks are performing poorly, allowing them to quickly resolve issues and ensure end users have an optimal experience.

Microsoft Teams Health Dashboard

In this dashboard tutorial video, we will walk you through building a Teams Health Dashboard by combining the collected metrics for CloudReady Synthetics and Service Watch Desktop. The Teams Health Dashboard provides users with a holistic view of Microsoft Teams availability and performance. When an issue occurs, users can quickly review the Teams Health Dashboard and identify whether the issue is limited to an office or affecting Microsoft Teams as a whole.

Email Health Dashboard

In this dashboard tutorial video, we’ll be walking you through building a Microsoft Exchange and Outlook dashboard utilizing CloudReady Synthetics and Service Watch Desktop. This dashboard is a great first stop when diagnosing user email issues. When an issue comes up, engineers can quickly review the CloudReady data available in the dashboard to identify if an office or Exchange Online is experiencing issues or an outage.

Actionable Alarms Dashboard

In this dashboard tutorial video, we will walk you through building an Actionable Alarms dashboard. This dashboard provides users with the visibility they need into the status of their SaaS solutions as well as how their end-user devices are performing. Dashboards allow combining both CloudReady and Service Watch data into a single pane of glass for visibility. Utilizing the Alarm widgets, users can quickly identify what issues need to be investigated while quickly being able to access the affected resources for review.

ConnectWise PSA Integration

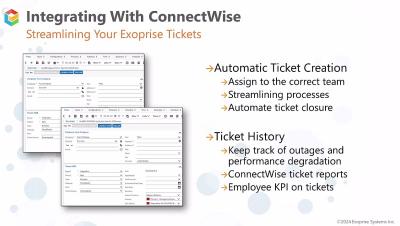
In this video, we will be reviewing the ConnectWise PSA integration along with it's benefits. We'll also walk you through the configuration process to quickly configure the integration. The ConnectWise PSA integration allows for tickets to be automatically created and closed upon Exoprise Alarms being triggered. With tickets being created in ConnectWise PSA, you can begin automatically assigning tickets based on the alarms triggered in Exoprise using workflow rules.

Digital Experience Monitoring for macOS

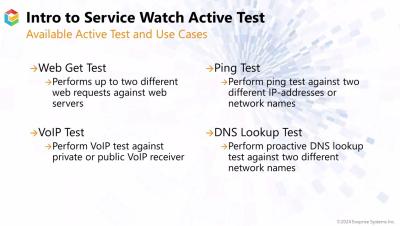
In this overview video, we'll be walking you through Service Watch Desktop for macOS. We'll cover the benefits of utilizing Service Watch for macOS and the configuration and deployment process. We'll then review the data being collected by Service Watch and some additional functionality in Active Tests, Device Groups, and Alarms.

Solve UC Problems Before They Cost Money

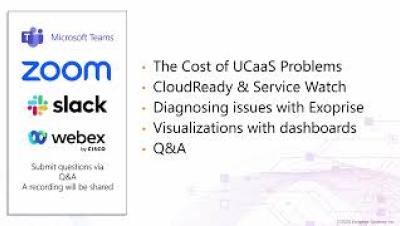
In this webinar, we discuss the high cost of UC&C application issues, and the impact these issues have on organizations. We'll be doing a deep dive of the amount of tickets organizations receive, the amount of time these tickets take to resolve, some real customer examples, the typical steps taken with and without Exoprise, and the ROI of real-user monitoring.