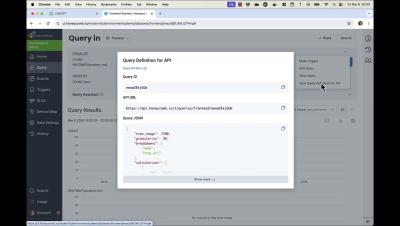
Operations | Monitoring | ITSM | DevOps | Cloud

Latest Videos

Trace at Your Own Pace: Three Easy Ways to Get Started with Distributed Tracing

Stepping through a trace is an invaluable debugging workflow, providing a way to follow requests from service to service even as the applications we manage become more complex and distributed. That same complexity can make getting started with distributed tracing feel overwhelming, but it’s important to remember that instrumenting your code is an additive process—you don’t need to boil the ocean. A trace through a thousand services starts with a single ID.

Learn How NS1 Uses Distributed Tracing to Release Code More Quickly and Reliably

Chris Bertinato, Software Architect at NS1, and Nate Daly, Head of Architecture at NS1 along with Jessica Kerr, Honeycomb Developer Advocate, and Account Executive Scott Phillips discuss how NS1 used distributed tracing to scale their organization and accelerate their migration from a monolith to microservices.

Discover Unknown Service Interaction Patterns With Istio & Honeycomb

Istio service meshes enable organizations to secure, connect, and monitor microservices to modernize their enterprise apps more swiftly and securely. With the addition of distributed tracing and powerful observability tooling, platform operators can gain immediate actionable insights about their applications.

Intercom: Building a More Resilient Ecosystem Through Observability

Learn how Intercom implemented Honeycomb’s distributed traces to learn about production. Kesha Mykhailov, Product Engineer at Intercom joins Honeycomb Developer Advocate Jessica Kerr, and Account Executive Michael Wilde to discuss how Intercom uses distributed traces to streamline their observability workflows, allowing their product engineers to learn about and from their production to increase Intercom’s resilience. Topics include.

See How Coveo Engineers Reduced User Latency

Many teams are wasting far too much time and energy searching through massive amounts of log data trying to find answers to user latency issues. Metrics data doesn’t help either as it only tells you that there is a problem, not where to fix it. This is why Coveo turned to observability. Through implementing observability with Honeycomb, Coveo was able to reduce their user latency by 50 percent.

Join Jeli and Honeycomb for an Incident Response and Analysis Discussion

Solutions Engineers Vanessa Huerta Granda and Emily Ruppe from Jeli, along with Honeycomb’s Field CTO Liz Fong-Jones and SRE Fred Hebert discuss some of our more interesting recent incidents and how we use Honeycomb and Jeli together for incident response.

Learn How SumUp Implemented SLOs to Mitigate User Outages and Reduce Customer Churn

Blake Irvin and Matouš Dzivjak from SumUp’s Software Engineering team, Honeycomb Solution Architect Michael Sickles and Account Executive Nathan Leary, discuss how SumUp incorporated observability, specifically, SLOs, to identify and resolve issues before they grew into customer-noticeable problems.