Operations | Monitoring | ITSM | DevOps | Cloud

Debugging

Profiling newlib-nano's memcpy

Newlib is a very popular libc targeting embedded systems. It’s the libc that ships with the GNU Arm Embedded Toolchain published by ARM. This article takes a look at one of the commonly used functions provided by the Newlib C library: memcpy. We’ll examine the default nano implementation and the performance implications, comparing it against the faster non-default implementation. Like Interrupt? Subscribe to get our latest posts straight to your mailbox.

11 Best Tips to Node.js Debugging that You Didn't Know

When people hear the term "Node.js Debugging," they immediately think of the function "console.log()." They also assumed that's how pros debug Node.js applications. Nah!!! That's not good enough, mate. You'll need more than the console.log() function to debug your Node.js application like a pro. If the proper technique is not taken before testing, debugging a Node.js application might be difficult. Testing is an essential part of the development process for any application, software, or website.

How Istio, Tempo, and Loki speed up debugging for microservices

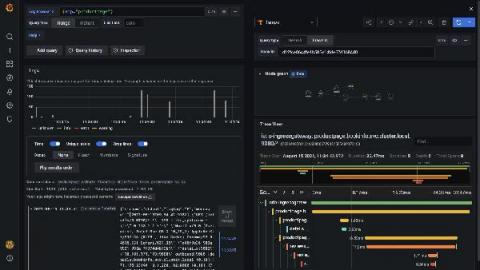
“How am I supposed to debug this?" Just imagine: Late Friday, you are about to shut down your laptop and … an issue comes up. Warnings, alerts, red colors. Everything that we, developers, hate the most. The architect decided to develop that system based on microservices. Hundreds of them! You, as a developer, think why? Why does the architect hate me so much? And then, the main question of the moment: How am I supposed to debug this?

Serverless observability and real-time debugging with Dashbird

Systems run into problems all the time. To keep things running smoothly, we need to have an error monitoring and logging system to help us discover and resolve whatever issue that may arise as soon as possible. The bigger the system the more challenging it becomes to monitor it and pinpoint the issue. And with serverless systems with 100s of services running concurrently, monitoring and troubleshooting are even more challenging tasks.

Remotely debug, monitor, and update Nordic IoT devices with Memfault

Nordic Semiconductor customers now have out-of-the-box access to Memfault's platform for remote debugging, continuous monitoring, and over-the-air (OTA) updates for Nordic-powered IoT products. Memfault and Nordic enable IoT device makers to accelerate product development and release more robust products that exceed customer expectations. In this webinar, you'll see how nRF91, nRF53, and nRF52 Series developers can access Memfault’s platform via the nRF Connect SDK for free.

How to Debug Remotely in VS Code

You’re likely familiar with local debugging—the ability to go through your code line by line to find and eliminate bugs. However, with the ever-increasing complexity of development environments, working efficiently with remote systems is becoming more necessary. In this case, “remote” can mean any machine you don’t have native OS-level access to, such as Virtual Machines, Docker containers, and entirely separate devices accessed over the network.

Debugging Cloud Functions

Developing a Cloud Function, but having issues troubleshooting it? In this episode of Serverless Expeditions Extended, we show you how to debug your function locally so you can avoid the risk of testing in production. Watch to learn how you can easily install the Functions Framework, set up the Node debugger, and fix your functions!