Kubernetes Monitoring with Prometheus: AlertManager, Grafana, PushGateway (part 2).
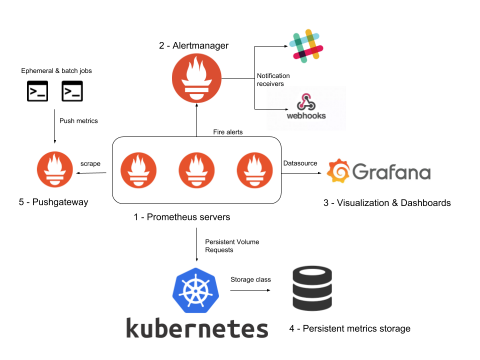
A complete ‘Kubernertes monitoring with Prometheus’ stack is comprised of much more than Prometheus servers that collect metrics by scraping endpoints. To deploy a real Kubernetes and microservices monitoring solution, you need many other supporting components including rules and alerts (AlertManager), a graphics visualization layer (Grafana), long term metrics storage, as well as extra metrics adapters for the software that is not compatible out of the box.


