Operations | Monitoring | ITSM | DevOps | Cloud
%term
Build and Run a Honeycomb Query right from your URL bar with Query Template Links
Whenever you run a Honeycomb query, you’re directed to the permalink for the results. Returning to this URL always supplies the same data without re-running the query, which is important when sharing links to make sure that everybody is looking at the same thing. However, there may be cases where you want a link not to a specific set of results, but to a set of query parameters which are re-run automatically. Further, you may want to generate these links without relying on the Honeycomb UI.
Comparing a Multi-Tenant SaaS Solution vs. Single Tenant
Let me preface this article with a quick customer story. I was recently talking with the director of operations of a G2000 company and he asked in a nice, but pointed way: “All I want is a SaaS software solution to manage my applications. Why does the architecture of the software matter?”. At Sumo Logic, we couldn’t agree and disagree more.
Azure Container Service (AKS): A Detailed Guide to Setting Up Your First Cluster with Kubernetes
Azure has an offering for Kubernetes: Azure Kubernetes Service (AKS). In this post, Learn more about AKS and show you two methods you can use it to create a cluster.
AppDynamics Unveils AppDynamics for SAP, Extending Business Transaction Tracing to SAP Environments
SAN FRANCISCO – May 22, 2018 – AppDynamics, a Cisco company and the leader in application intelligence, today announced the availability of AppDynamics for SAP. Appdynamics for SAP is an application performance management solution for SAP environments that provides the deepest visibility from code-level insights to customer taps, swipes and clicks — helping enterprises deliver the flawless experiences their customers demand.
Support for AWS Application Load Balancer in the Honeycomb AWS Bundle
When we announced support for ingesting AWS Elastic Load Balancer access logs to Honeycomb, one of the first follow-up requests was for us to add support for AWS Application Load Balancer as well (which, alongside the Network Load Balancer, represents ELBv2). Given the list of features that ALB supports, it’s not difficult to see why. Who doesn’t want microservice-friendly path routing, native HTTP/2 support, tight integration with Amazon’s container-related services, and more?
The power of proposals (and open source culture)
I come from a world where strategy is best kept secret. Whether it be from a company who has a codename for literally everything, or the competitive culture of playing and coaching D1 athletics, confidentiality became a required skill. Meetings, trainings, code reviews, scouting reports… anything of significance happened behind closed doors. In other words, definitely not open source.
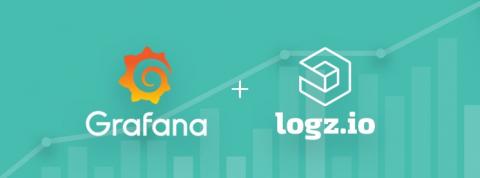
Integrating Logz.io with Grafana
While Logz.io provides Kibana — the ELK Stack’s visualization tool — as part of its service, a lot of users have asked us to support Grafana. One of the leading open source visualization tools today, Grafana has some added value when compared to Kibana, especially around visualizing time-series data.
Introducing Sentry 9
Errors. We all cause them all the time, which can make it difficult to figure out the person or team who should be responsible for fixing individual issues. Time that could be spent resolving an issue is instead spent tracking down who should be handling it and what it’s even about. This is a waste. It balloons time to resolution, often from minutes to hours or sometimes even days.
How you can take back control over your log analytics with AI
We’ve all been there — you’re on-call, fast asleep at 3 AM when suddenly, in comes the alerts–in overdrive. Your system is notifying you of some sort of abnormal behavior, but with all the alerts and data coming through, its difficult to figure out what your system is trying to tell you. Is there potential malicious behavior? Did someone write faulty code? Is it an important issue or can it wait? Is it nothing at all?


