Operations | Monitoring | ITSM | DevOps | Cloud

Product Release

Netdata is launching its Discord server

It’s been a long time since our last community update, rest assured that we have been hard at work here at Netdata. Community building is hard, especially when you have such a venerable community like the one here at Netdata, where hundreds of contributors have contributed to creating one of the best monitoring solutions that exist. Last year we started to concentrate working on consolidating the community by integrating the various platforms where people come together to talk about Netdata.

What's new in Sysdig - June 2021

Welcome to another monthly update on what’s new from Sysdig! Happy Pride month! We hope you are celebrating safely, in whatever manner you choose. It’s been over 50 years since the Stonewall riots, but we continue to fight for equality and justice. Love is love, and we’re sending you all of ours! Thank you to Marsha P. Johnson, Brenda Howard, and countless others for fighting for the freedom that many of us today enjoy.

PagerDuty Summit 2021 Platform Release: Digital Operations Now

We are delighted to welcome you to another PagerDuty Summit and excited to announce a plethora of product developments designed to help you accelerate your digital transformation. And what an accelerator the COVID-19 pandemic has been for innovation. It really brought into focus the seemingly distant goal of becoming digital-first. Organizations who were truly prepared and benefited from the radical shift in how they did business thrived and rose to the top.

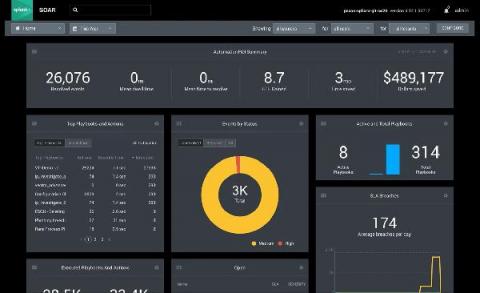
Introducing the World's First Modern Cloud-Based SecOps Platform: Splunk Security Cloud

To say that the past year presented its fair share of cybersecurity challenges to the InfoSec community would be a drastic understatement. The rapid migration to remote work at scale left 80% of CIOs unprepared, and SecOps teams struggled to confront the evolving threat landscape with disparate toolkits and skill sets. Not to mention that as more organizations shifted to hybrid and multi-cloud environments at scale, cloud complexity (and cloud-based threats) skyrocketed.

Announcing LogDNA Agent 3.2 GA: Take Control of Your Logs

The LogDNA Agent is a powerful way for developers and SREs to aggregate logs from their many applications and services into an easy-to-use web interface. With only 3 kubectl commands, the installation process is quick and simple to complete for any number of connected systems. To help control the logs that are stored and surfaced in the LogDNA web interface, users can set Exclusion Rules, which enables the exclusion of certain queries, hosts, and tags directly from the UI.

Monthly Moo Update | May 2021

Goodbye May, Hello June! It’s summertime in the northern hemisphere and the sun is shining bright, along with updates we’ve got for you this month. The team at Moogsoft is working on a few big items that will be sure to put a smile on your face. But, lest we forget about some of the smaller items that help you day in and day out.

Introducing the Nexthink Service Graph Connector

Configuration Management Databases (CMDBs) are key elements of any IT infrastructure. In large or growing organizations, however, successfully managing a CMDB is no easy feat. After all, IT Operations teams are responsible for managing tens of thousands of data points in dynamic environments. Lack of visibility, shallow troubleshooting, and the overall maintenance of a “healthy” CMDB can quickly lead to frustrations and result in expensive professional services support.

Complex Messaging Workflows on Demand with VMware Tanzu RabbitMQ 1.1

Three months ago, we launched VMWare Tanzu RabbitMQ for Kubernetes to automate high-performance messaging on demand with our cluster Operator.* Since then, customers have approached us with higher-level needs that inspired us to extend and improve Tanzu RabbitMQ. In other words, you’ve spoken, and we’ve listened. And so now, in version 1.1, we go well beyond automating cluster operations to orchestrating complex topologies, adding alerts, and previewing active-passive replication.

Find the Root Cause Faster with Trace View and Trace Navigator

Like a bratty teenager, traditional monitoring answers your questions, but does so in a terse, unhelpful manner: Why is my page slow? Guess it’s the API call. It’s a 504 thing — you wouldn’t understand. Ok, so why is the API call slow? Ask your DB query. Gosh! You need a better conversation with your code — one which gives you contextual clues about your application’s performance.