Operations | Monitoring | ITSM | DevOps | Cloud
SigNoz
Bringing out of the box application monitoring to Prometheus
Prometheus is undoubtedly growing as the native monitoring tool for Kubernetes. We have been using Prometheus to collect metrics about our infrastructure for a long, but setting it of the box is still painful.
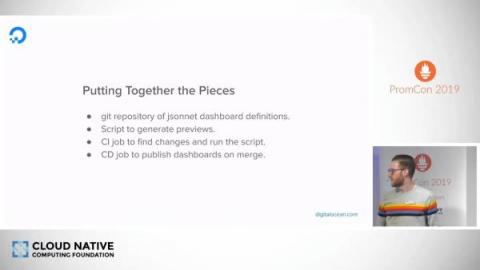
My 7 key takeaways from PromCon 2019
PromCon is one of the premier conference on Prometheus and related tools like Grafana. This is held every year where developers from around the world gather to learn the latest in monitoring technologies.
Quantile Aggregation for statsd-exporter in Prometheus
In this blog, we shall send observation frequencies in the bucket intervals chosen and aggregate those at the Prometheus back-end.
Monitoring Tools: Comparing Instana and Sysdig
In this blog, we compare Instana and Sysdig - two popular monitoring tools which claim to show APM metrics without need to instrument code.
Monitoring OpenMetrics for Gunicorn and Django application in Prometheus
In this blog, I will discuss about how to set up Prometheus and Grafana in EKS and how to monitor Python based applications using Prometheus.


