Operations | Monitoring | ITSM | DevOps | Cloud
ObservIQ
How to collect metrics and logs for NGINX using the OpsAgent
The Ops agent is Google’s recommended agent for collating your application’s telemetry data, and forwarding them to GCP for visualization, alerting and monitoring. The Ops agent collates logs and a metrics collector into one single powerhouse. Some of the key advantages of using the Ops agent are outlined below.
What's New at observIQ
You may have noticed a few changes around here. If you explore our new website, you’ll notice new products, expansions to our open source libraries, significant contributions to our favorite open source project, OpenTelemetry, and new integrations with Google Cloud. You might just think we’re taking “new year new me” a little too seriously, but in fact we’ve been planning some of these changes for a long time. It all stems from our firm belief in open source technology.
observIQ - Uber for Duckwalking
The Illusive World of Monitoring for Legacy Systems
In the tech industry, we obsess over the latest and greatest. When it comes to observability, we’re always looking at the most advanced hardware, the enthusiasts’ favorite systems, and the tech venture capital trends to get an idea of what to build for next. observIQ is no exception.
How to set up Stanza as the log agent for your GCP?
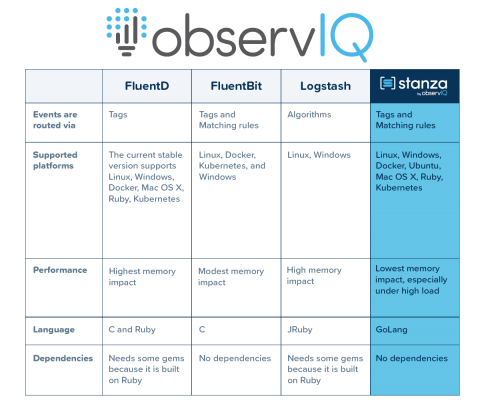
Stanza is a robust log agent. GCP users can use Stanza for ingesting large volumes of log data. Before we dive into the configuration steps, here’s a matrix detailing the functional differences between all the common log agents used by GCP users. Stanza was built as a modernized version of FluentD, Fluentbit, and Logstash. GCP users now have the ability to install Stanza to their VMs/ GKE clusters to ingest logs and route them to GCP log explorer.
What's Wrong With Observability Pricing?
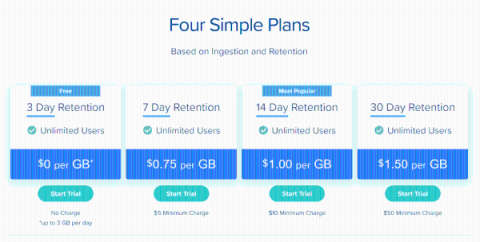
There’s something wrong with the pricing of observability services. Not just because it costs a lot – it certainly does – but also because it’s almost impossible to discern, in many cases, exactly how the costs are calculated. The service itself, the number of users, the number of sources, the analytics, the retention period, and extended data retention, and the engineers on staff who maintain the whole system are all relevant factors that feed into the final expense.
5 Weird Use Cases for Log Management
We’re all familiar with the typical use cases for log management, such as monitoring cloud infrastructures, development environments, and local IT infrastructure. So we thought it would be fun to cover some of the less usual, more wild use cases for log management, just to show that log management tools are more versatile, and more interesting, than they may seem. If any of these use cases look too interesting to ignore, let us know and we can do a full article on them!
Log Management 101: Log Sources to Monitor
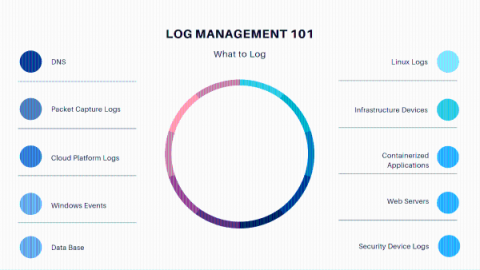
Log management software gives the primary diagnostic data in your applications’ development, deployment, and maintenance. However, choosing the log sources to log and monitor could often be a daunting task. The primary cause of concern in monitoring all sources is the high price tag that many SIEM tools in the market charge based on the number of users and sources ingesting logs. At observIQ, we offer unlimited users and sources.
Why your log management software may not give you the real Dashboard experience
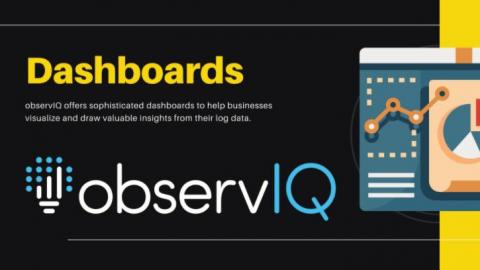
Visualizing log data is one of the biggest perks of using good log management software. Data is many businesses’ most critical asset. But, without proper use, a business’ data becomes just an artifact and no longer an asset. Visualization and analysis are the end goals of collating log data from their sources. The need for visualization arises from the fact that we intuitively process visual information faster than a random jumble of numbers and letters.


