Operations | Monitoring | ITSM | DevOps | Cloud

ObservIQ

How to monitor Tomcat with OpenTelemetry

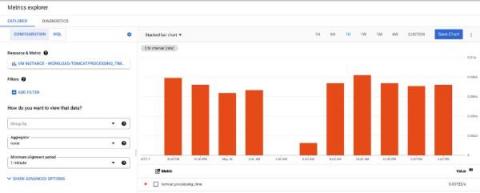
We are constantly working on contributing monitoring support for various sources, the latest in that line is support for Tomcat monitoring using the JMX Receiver in the OpenTelemetry collector. If you are as excited as we are, take a look at the details of this support in OpenTelemetry’s repo. You can utilize this receiver in conjunction with any OTel collector: including the OpenTelemetry Collector and observIQ’s distribution of the collector.

Filtering Metrics with the observIQ OpenTelemetry Collector

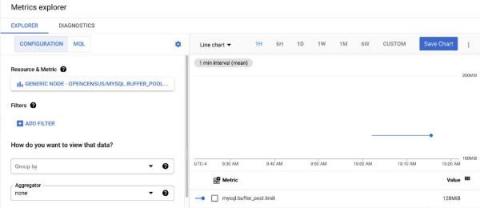
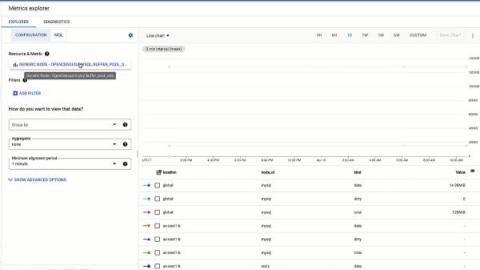
In this post, we will address the common monitoring use case of filtering metrics within the observIQ OpenTelemetry (OTEL) collector. Whether the metrics are deemed unnecessary, or they are filtered for security concerns, the process is fairly straightforward. For our sample environment, we will use MySQL on Red Hat Enterprise Linux 8. The destination exporter will be to Google Cloud Operations, but the process is exporter agnostic.

How to monitor Elasticsearch with OpenTelemetry

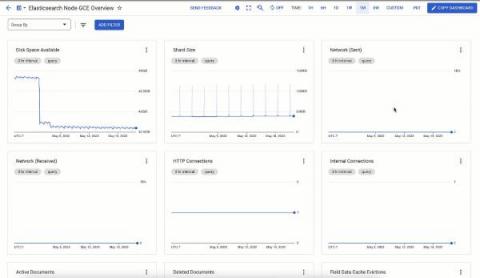
Some popular monitoring tools in the market can complicate and create blind spots in your Elasticsearch monitoring. That’s why we made monitoring Elasticsearch simple, straightforward and actionable. Read along as we dive into the steps to monitor Elasticsearch using observIQ’s distribution of the OpenTelemetry collector. To monitor Elasticsearch we will configure two OpenTelemetry receivers, the elasticsearch receiver and the JVM receiver.

How to Monitor Active Directory with OpenTelemetry

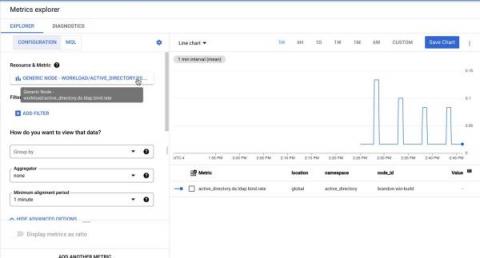
We’re excited to announce that we’ve recently contributed Active Directory Domain Services (abbreviated Active Directory DS) monitoring support to the OpenTelemetry collector. You can check it out here! You can utilize this receiver in conjunction with any OTel collector: including the contrib collector, the observIQ’s distribution of the collector, as well as Google’s Ops Agent, as a few examples.

How to monitor MongoDB with OpenTelemetry

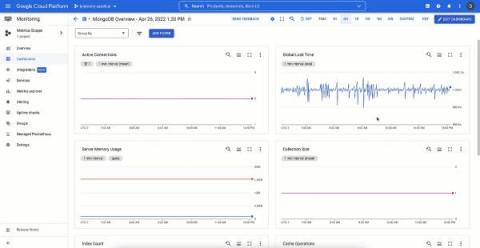
MongoDB is a document-oriented and cross-platform database that maintains its documents in the binary encoded JSON format. Mongo’s replication capabilities and horizontal capability using sharding make MongoDB highly available. An effective monitoring solution can make it easier for you to identify issues with MongoDB such as resource availability, execution slowdowns, and scalability. observIQ recently built and contributed a MongoDB metric receiver to the OpenTelemetry contrib repo.

How to Monitor Microsoft IIS with OpenTelemetry

The OpenTelemetry members at observIQ are excited to add Microsoft IIS metric monitoring support to OpenTelemetry! You can now easily monitor your IIS web servers with the oIQ OpenTelemetry Collector. You can add the IIS metric receiver to any OpenTelemetry collector. This post demonstrates just one configuration for shipping metrics with OpenTelemetry components. This configuration and many other observIQ OpenTelemetry configurations are available in the oIQ Opentelemetry Collector.

How to Monitor Host Metrics with OpenTelemtry

OpenTelemetry is at the core of standardizing telemetry solutions. At observIQ, we’re focused on building the very best in open source telemetry software. Our relationship with OpenTelemetry began in 2021, with observIQ, contributing our logging agent, Stanza, to the OpenTelemetry community. Now, we are shifting our focus to simplifying OpenTelemetry solutions to its large base of users.

How to Monitor Riak Metrics with OpenTelemetry

observIQ’s OpenTelemetry members contributed Riak metric monitoring support to OpenTelemetry! You can now monitor your Riak agent performance with OpenTelemetry, and deploy simply with the oIQ OpenTelemetry Collector. You can add the Riak metric receiver to any OpenTelemetry collector. This post demonstrates a configuration for shipping metrics to Google Cloud Operations with OpenTelemetry components.