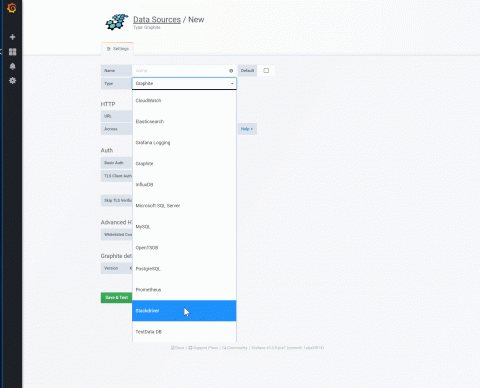
Introducing Stackdriver as a data source for Grafana
It is not uncommon to have multiple monitoring solutions for IT infrastructure these days as distributed architectures take hold for many enterprises. We often hear from Google Cloud Platform (GCP) customers that they use Stackdriver to monitor resources as well as Grafana and Prometheus for container monitoring. We’ve heard lots of requests from customers to be able to view Stackdriver data in Grafana effortlessly.


