Operations | Monitoring | ITSM | DevOps | Cloud
%term
re:Invent Highlights-Day Four
Though re:Invent technically runs for another day, the fourth day is traditionally the final day in terms of large announcements — this certainly rings true for this year as well, with several significant announcements from Amazon and associates.
5 Things You Need to Know About Business Continuity Management
If business professionals ignore network and system issues, the consequences could be dire. For instance, imagine what might happen if your company suffers a cyberattack, flood or supply chain failure. In this scenario, your critical networks and systems may slow down or stop working. And if you lack an effective business continuity management (BCM) strategy, you risk downtime and outages that could put a significant dent in your business’ bottom line.
How to deploy infinitely scalable applications to AWS in minutes with Up & Semaphore CI
Many Apex Up users have been asking about integration with continuous integration platforms, this post walks through staging and deploying Up to production using Semaphore CI.
Episode #108 - Tracking Errors with Sentry
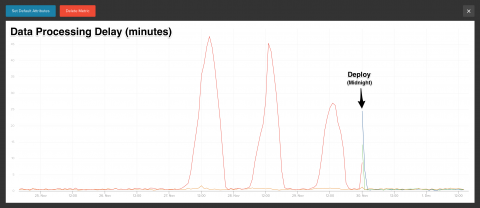
This Week's Data Processing Lag
This week at Skylight HQ (technically it’s in the Cloud somewhere), we were hit with a pretty big surge of requests on our collector (Cyber Monday perhaps?). Fortunately our backend is architected to handle a very large volume of data from the agents with minimal latency, so this kind of surge on our backend would not affect the performance of your apps in any way (in addition, the agent is sending data in the background from a different process separate from your app/server).
Receive huge website monitoring discounts!
Website monitoring discounts are now available.
Manage incident notifications with alert toggling
Letting the right people know about incidents is an easier-said-than-done kind of task. Every incident is different and some notifications simply don’t need to land in everyone’s inbox. We’ve listened to a lot of customers who like the idea of posting an incident to their status page, but not having that incident sent as notifications to all their subscribers.
Prometheus Tutorial
Prometheus Monitoring Tutorial
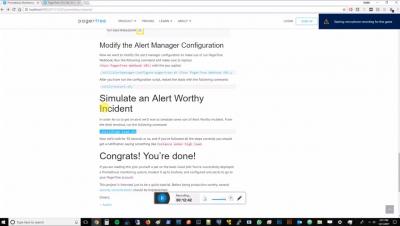
In this post, I will walk you through creating a simple Prometheus monitoring stack, connecting it to Grafana for pretty dashboards, and finally configuring alerts via PagerTree.


