Operations | Monitoring | ITSM | DevOps | Cloud

Blog

Get your sheet together: how to create an incident communication plan

Downtime happens. While it can certainly be chaotic and stressful, if handled properly, it can also be a chance to build customer trust and loyalty. The way you respond to and communicate around incidents and downtime tells customers a lot about what you value. Therefore, it’s essential to show customers you value them by communicating early, often, and candidly during an incident.

Share Context With Collaboration: Suggested Query Boards

Nobody knows your services/infra better than you, not even Honeycomb. If there’s one maxim for Honeycomb, it’s that context is king. Context determines the questions you can ask. The only way to make complex systems truly tractable is to make all questions possible. Ergo: more context. Context everywhere. Context coming out of the walls. You should be awash in context.

How to monitor JavaEE applications' EJB method performance on WebLogic?

Previously on WLSDM blog, we have learned about monitoring applications’ database statements (JDBC SQL) and performance on Oracle WebLogic server. In this blog post we have created another tutorial to learn how to monitor and diagnose WLSDM back-end EJB business method invocation events.

Raygun and Java: Better error monitoring with Breadcrumbs and more

Raygun Crash Reporting has supported the Java Framework since we launched. As a Java customer, you’ve always been able to catch errors pre and post-production, receive alerts, and provide one source of truth for errors on your whole team. Now, Raygun provides full feature support for Raygun4Java. Java customers now have access to all our favorite Raygun features, like Breadcrumbs, offline support, web service support, and sensitive data filtering.

Set Up for Success: Service Taxonomies in PagerDuty

It’s 2:37 a.m. on a Tuesday night, you’re asleep—but it’s also your turn to be on call. You receive a phone call from PagerDuty. Your partner hits you with a pillow in an attempt to wake you up. It worked. You groggily answer the call and hear your favorite robo-guy on the other end of the line.

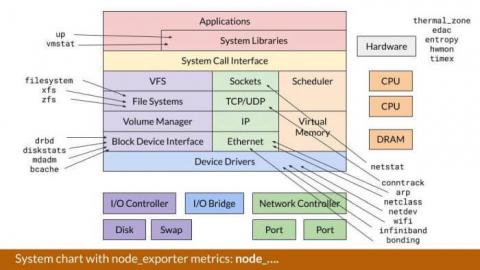
Monitoring Server Performance

This is the first in a series on server monitoring. The primary focus of these posts is monitoring in a *nix environment. Monitoring servers is important. Whether it be finding an issue in a test environment prior to deploying or debugging an issue in production, we need access to information on our server to be able to tease apart what went wrong.

What is Citrix Director? Understanding the Monitoring Capabilities of Director and How It Can Be Used

Citrix Director is a web-based monitoring console for Citrix XenApp and XenDesktop virtualization platforms that allows administrators to control and monitor virtual applications and desktops. Starting with version 7, Citrix Director is the default management tool, replacing the erstwhile Citrix EdgeSight.

Unearth new repositories and Git v2 improvements in Bitbucket Server 5.13

How much time do you spend every week trying to find things? At home, it’s finding your keys and, at work, it’s finding the root cause of a bug or an old pull requests that introduced the bug. Since we’re not in the business of tracking your keys, Bitbucket Server 5.13 is making it easier to discover repositories and find pull requests tied to a given commit. You can also enjoy support for Git v2, with faster no-op fetches.