Operations | Monitoring | ITSM | DevOps | Cloud

How to

How to Manage Kubernetes Resources and Costs with Grafana Cloud

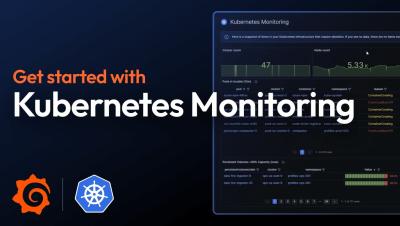
To help optimize your Kubernetes resources (and the costs associated with them), Kubernetes Monitoring in Grafana Cloud offers features to manage and monitor Kubernetes resources and, in return, your observability bills. In this video, we'll show you how Kubernetes Monitoring helps you: ☁️ Grafana Cloud is the easiest way to get started with metrics, logs, traces, dashboards, and more. We have a generous forever-free tier and plans for every use case.

New TraceQL metrics feature in Grafana Tempo 2.4

In this video, you'll see a deep dive demo into the experimental TraceQL metrics feature in Grafana Tempo 2.4. We'll show you how to use TraceQL metrics to do both root cause and impact analysis as well as other use cases, such as determining how many database queries are downstream of your application. ☁️ Grafana Cloud is the easiest way to get started with metrics, logs, traces, dashboards, and more. We have a generous forever-free tier and plans for every use case.

Getting started with Pyroscope: Intro to continuous profiling

Grafana Pyroscope is a multi-tenant continuous profiling aggregation system, aligning its architectural design with Grafana Mimir, Grafana Loki, and Grafana Tempo. It facilitates the ingestion, storage, and querying of profiles and seamlessly integrates with Grafana, enabling a cohesive correlation of profiling data with existing metrics, logs, and traces.

Evaluating Traffic at IXes and Data Centers with PeeringDB Filters in Kentik

Kentik Product Marketing Manager Lauren Basile shows how to leverage Kentik's integration with PeeringDB to enhance network performance, reliability, and cost efficiency. Lauren demonstrates practical examples of how network professionals can use PeeringDB filters in Kentik to make informed decisions about internet exchanges and data centers, optimize peering arrangements, and uncover potential cost savings.

Kubernetes Monitoring: How to Get Started in Grafana Cloud | Grafana

Start monitoring your Kubernetes cluster in less than 3 minutes! This is a quick but comprehensive guide for getting started with Kubernetes Monitoring in Grafana Cloud. Ideal for both beginner and experienced users, you'll see a step-by-step approach for installing the Helm chart on your Kubernetes cluster so you can validate the health and integrity of your infrastructure. Helpful links: ☁️ Grafana Cloud is the easiest way to get started with metrics, logs, traces, dashboards, and more. We have a generous forever-free tier and plans for every use case.